Exploit Supply & Demand Imbalances using Order Flow and Algorithmic DELTA Analysis
The indicators in the BoxWave are designed to work together and to recognize areas of supply / demand imbalances to exploit in the markets. It consists of the following indicators:
The Wave Indicators allow you to see supply and demand in the markets. The markets are a constant battle of the bulls and the bears. Price moves in an up and down direction like a zig zag or see saw going up down up down, up down, etc…. continuously and without end. These movements can be better described as waves.
Wyckoff talked about viewing market movements as a series of waves to better understand its movement. Wyckoff stated that when buying waves begin to increase in volume, time, length and the selling waves shorten we should watch out for a change in trend. The same applies vice versa.
Viewing market movement as waves filters out a lot of the bar to bar noise and allows one to take a step back and see at a higher level as to what it is going on. In general, we are trying to identify states of market balance and imbalance when considering making a trade. When the market is in balance (supply and demand are met more or less equally) the market moves laterally. When the market is in imbalance we see great movements. The goal is to exploit these imbalances.
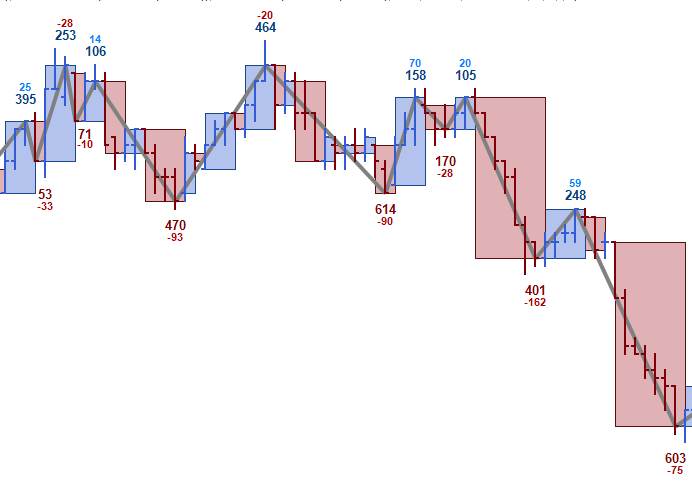
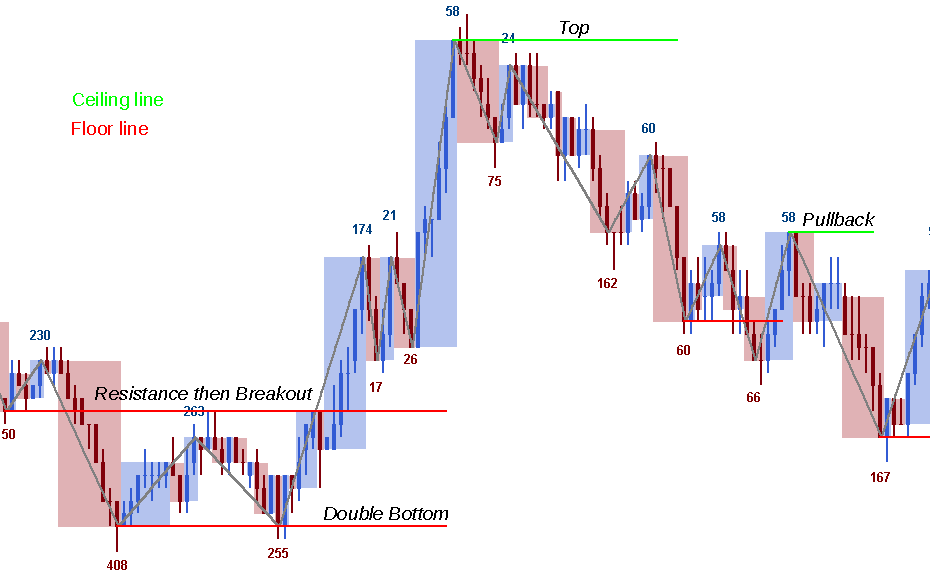
The GannSwing is a very powerful indicator depicting order flow and the constant battle between supply and demand very clearly. It utilizes W.D. Gann’s swing chart construction rules for drawing waves on the chart.
The waves produced by the Gann Swing find relevant high / low points and show in which direction price is trending. Since the waves are fractal in nature, the settings never have to be changed regardless of timeframe.
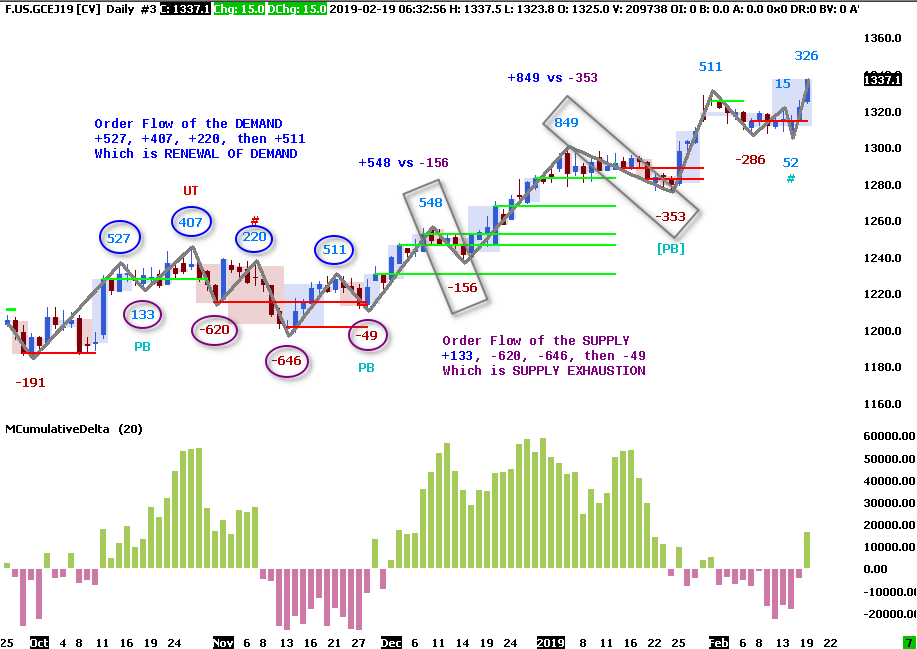
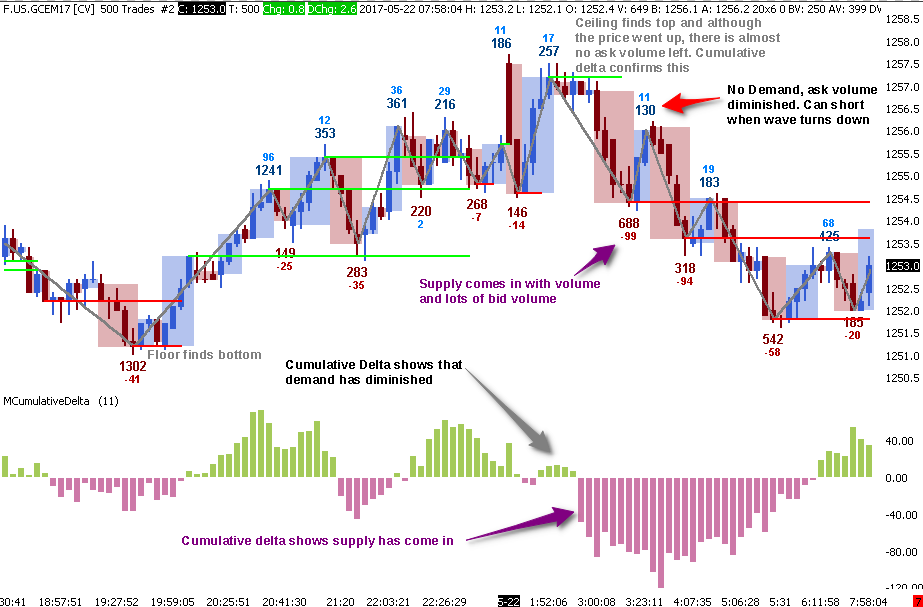
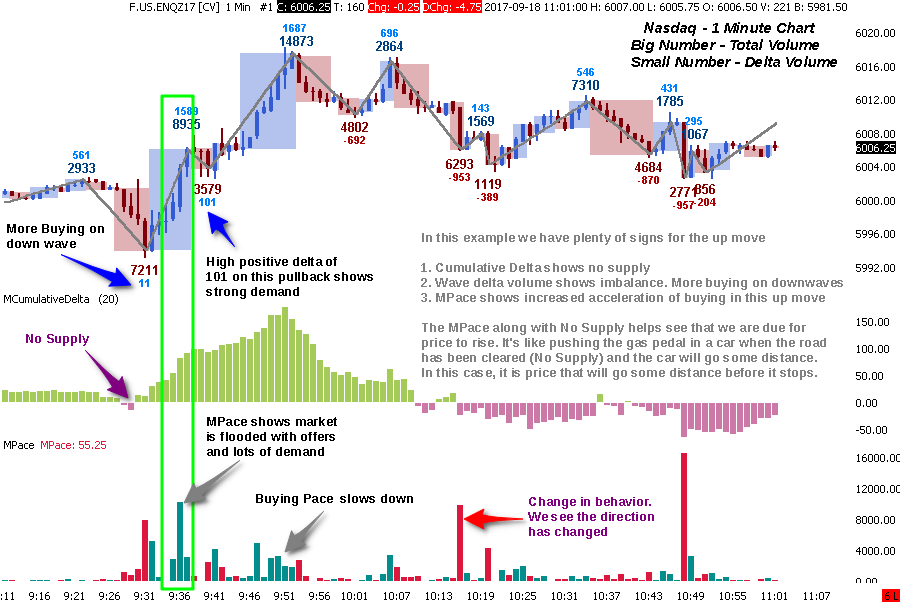
The CumulativeDelta Indicator shows the buying / selling pressure that is happening in the market. It serves to determine whether supply or demand is dominating and in control.
The use cases for this indicator are vast. The following examples will explain how to use this indicator.
The AutoFloorCeiling indicator is the culmination of over 2 years of research to determine Support / Resistance levels automatically. The heart of it utilizes a powerful algorithm based on Wyckoffian concepts of waves, volume, and price levels.
This indicator gives great insight as to ideal places to enter trade positions. The goal is to make great trades with a high degree of confidence.
The Pace indicator is built to show The Tape Speed on the Floor. Obviously in today’s markets we no longer have the Floor, but we have something very much like the floor called “level 2” data which allows us to see inside the data. In other words, most people think price is the the ultimate leading indicator but the truth is price does not change randomly, price changes by the BID and ASK quantity.
The Pace indicator show the Velocity (speed) of the tape and allows you to see the speed at which the BIDS are being HIT and the speed at which the OFFERS are being lifted.
When you understand how Velocity works… it shows when a market is changing direction (because in order to change direction the velocity slows down) AND when a market is in FULL FORCE and ready to continue moving in the current direction. Back in the day (on the Floor), the “ROAR OF THE FLOOR” had a certain FEEL to it or Intensity and traders could Gauge the acceleration or deceleration by the Roar. Simply put, the direction could be detected by the speed and decibels of the Roar.
Up to now, I have never seen an indicator based on the ROAR OF THE FLOOR, but with the Pace indicator, you can now see the acceleration or deceleration of a move to know when it’s time add-on or drop off to the PACE OF TRADE.
Most floor traders that have moved to the screen miss cues they used to get while trading on the floor. Hearing and feeling the noise and frenzy of a heated market is a big one of them. The Pace Indicator lets you SEE that frenzy on your screen. If you are a momentum trader, you want to be in on that move.
One key element of the Pace indicator is that it works especially well on intraday time based charts.
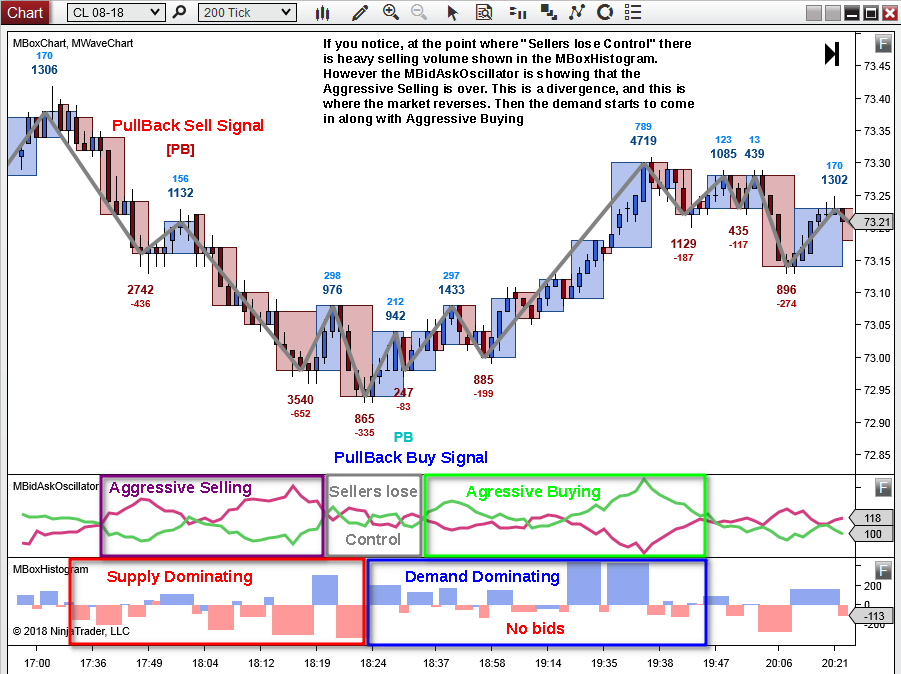
The BidAsk Oscillator separates volume into trades executed at the best bid price and trades executed at the best ask price. This indicator gives you insight into the market action because you can see whether sellers are aggressive or buyers are aggressive.
Use Cases
1. When the Bid / Ask Lines have a wide gap, this shows which side is dominating.
2. When a Bid / Ask Line is low, you can spot areas of NO SUPPLY / NO DEMAND.
3. When either the Bid / Ask Line diverges from Price (meaning going in opposite direction), get ready for a change in trend. Can be very powerful!
4. When the Bid / Ask Lines cross, this shows the shift between Buyers / Sellers trying to move price in their direction.