

OrderFlow Trading Tools
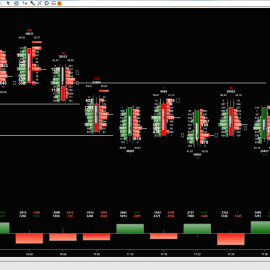
Visual
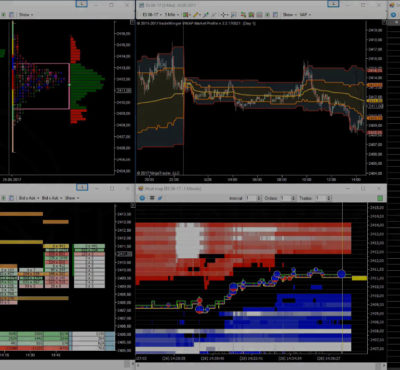
Seen through a clear and visually pleasing interface, as buyers and sellers behave. Use that information to make decisions that help you improve your trading.
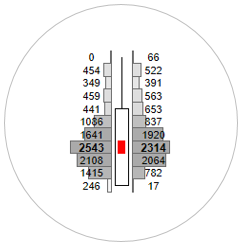
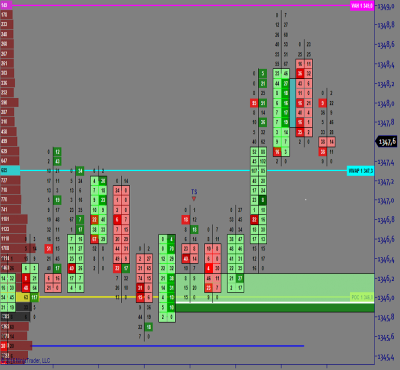
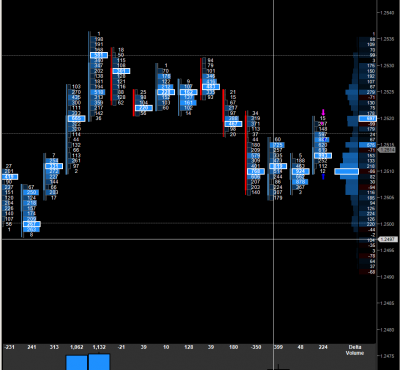
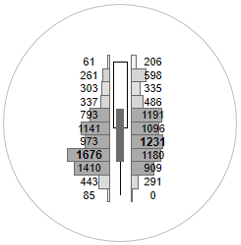
VPOC
Always keep at which point the market has traded more. Use the parameters of the indicator to mark the points you want, based on a maximum or minimum volume.
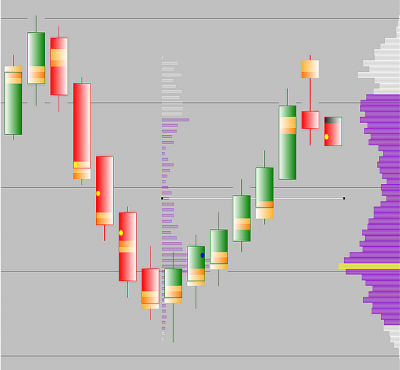
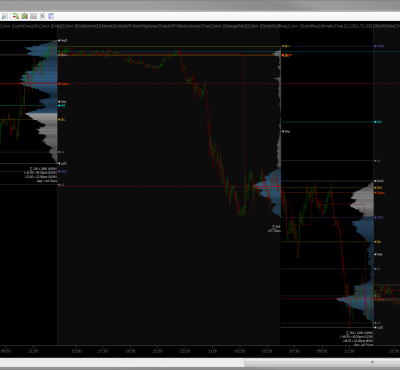
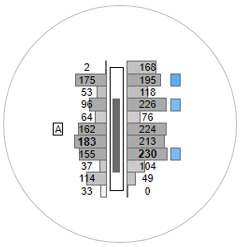
Value Area
Locate at a glance, where the value is generated in each candle. See if it's ascending, descending...and get to determine precise intentions based on the value generated by buyers and sellers areas.
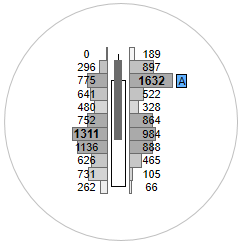
Imbalance
Detects simple and visual way where activities occur with an important difference in interest. Use the parameters to filter that information in the indicator, based on a maximum and minimum volume.
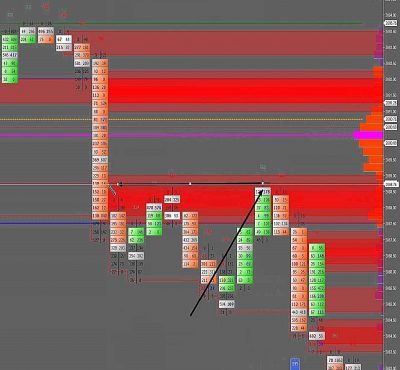
Absorptions
Look areas where it has clear intention from traders to start or continue a direction. Use the parameters to filter those intentions in the indicator, based on a maximum or minimum volume.
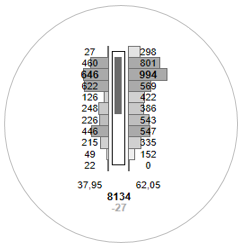
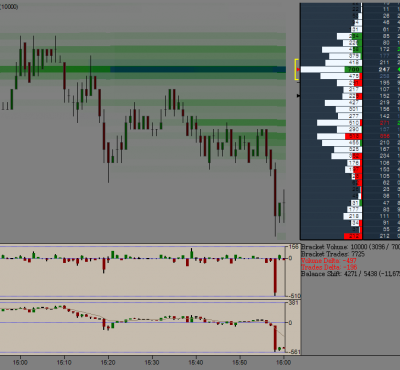
Total Volume
Notes volume quickly as trade in each candle, to see how much interest there is. See if the volume increases or decreases and the effect on the direction.

Latest from the Blog
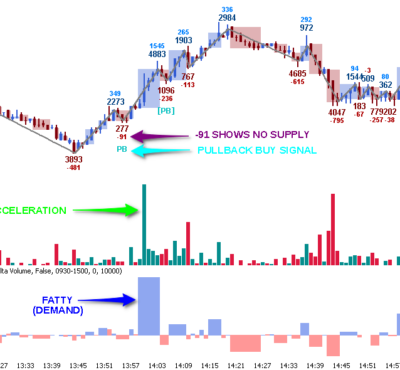
OrderFlow & Reading the Delta
Trading order-flow is one of the only ways you can really “see inside the bars.” Buying and selling pressure is much easier to spot when it’s right there in the numbers in front of you, printing in real-time. The OrderFlow software makes pressure imbalances obvious... Read More
Footprint Charts and How they’re Commonly Used
The most common problem traders face when reading technical charts is determining the right profit- taking and stop loss points. The market ‘noise’ caused due to short-term volatility most often triggers a panic response due to which... Read More