Volume Spread Analysis identifies the moves made by the “Smart Money” – the institutional investors, hedge funds and investment banks who consistently make money in the markets – so you can trade in harmony with them – buy when they buy, sell when they sell.
The VSA Sequential Scanners scan the markets for trend alignment and VSA set ups.
They can scan up to 25 trading instuments simultaneously across 10 time-frames and will show you graphically when there is trend alignment across multiple time-frames.
When trend alignment is seen – espcially in larger time-frames – the chance of making successful trades is much higher.
The scanners will also scan for and then diplay, the VSA indicators in the scan window.
The scanners can be configured to send you email alerts when key VSA indicators and VSA setiups have been triggered.


VSA Indicators.
There are 2 types:
VSA Indicators which alert you when major VSA principles indicate a potential future market turn.
VSA Confirmation Indicators which confirm the VSA principle.

When you click on an indicator – the green or red triangle symbols – a dialogue box appears giving you detailed information about the trading area you are looking at. Written by the inventor of VSA, the late Tom Williams, the dialogue box contains three sections:
1. Price bar description: The latest populated price bar and what it means in VSA terms.
2. The Background: This is very important as it can influence how the market reacts to the indicator in question. You must look back 1 to 50 bars for high / ultra-high or low / ultra-low volume accompanied by a major VSA Indicator. If there are VSA Indicators in the background this adds extra weight to the strength of the Indicator you are looking at.
3. The Future: This gives you strong support when deciding whether to trade or not. This section will tell you to wait for at least two bars.

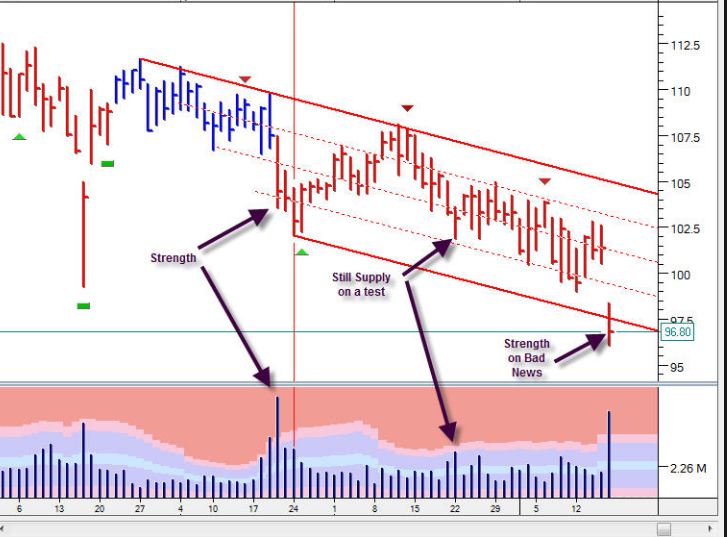
Volume Thermometer Bar
The software is continuously llooking to see the relative amount of bullish and bearish volume at any particular time. The results of this analysis are shown in the bottom bar of the chart.

If the bar is green the volume is bullish, if it is red then the volume is bearish.
It is best to use the relative volume tool to aid you in your entry or exit.
Short Term Trending Tool
Whatever your trading style, the short-term trending tool is a flexible indicator that can be set up to help you in ‘scalping’ or swing trading on intraday charts, position trading on daily charts, or even in medium/long-term investing on weekly or monthly charts.
The circular dots display in 3 colors; red for a short-term down-trend, green for a short-term up-trend and grey when the market is in congestion.
As well as the changing colour of the dots, one of the great things about this indicator is the way it levels out, as prices become slow to progress. If prices suddenly surge forward, it will also accelerate upwards or downwards, smoothing out the fluctuations caused by minor corrections or reactions.

Medium Term Trending Bar
There is a second trending system that is designed to be a lot more insensitive to minor trend changes. The medium-term trend tool is a volatility-driven system which takes into account how much a market moves. The more a market moves, the more forgiving the system becomes to adverse price excursions against the trend. However, if a market isn’t that volatile, the trending system becomes more responsive to movement.

Medium-term up-trends are signified by the bar turning green, while medium-term down-trends are represented by the bar turning red. This tool compliments the short-term Trending Tool, to provide further confirmation, or to spot counter-trend trading opportunities.
VSA Tracker Stops
The Tracker Stop system follows the price up or down depending on whether you are long or short.
There are 2 levels on each bar – either above the bar for short trades, or below, for long trades. If the stops straddle the bar then the chart is in congestion.
The Stop furthest from the bar (light blue) is more conservative and has less risk than the H-Stop nearest the bar (light brown).

Trend Cluster Tool
We call the point where historical trend lines intersect a ‘trend cluster’, and a rectangular block will be displayed on the right side of the chart. Trend clusters represent strong areas of resistive price levels.
When these appear the software has picked up intersecting trend lines and channels either above the price action (showing resistance to higher prices), below price action (which shows support below price action), or straddling above and below price action, which often indicates congestion as prices bounces off both the upper and lower trend clusters.
On the right edge of the chart you will see a maximum of 10 clusters displayed with up to 3 different severity levels. When the prices break past the cluster, they tend to continue in the same direction, until further support or resistance is encountered. There are examples of this happening in the chart on the previous page.
This tool is very useful for helping to refine entry points and determine exit points.

METHODOLOGY

Volume Spread Analysis (VSA) methodology looks at the relationship between price, spread or range, and volume. VSA is a proprietary market analysis method conceived by veteran trader, Tom Williams, who was a highly successful member of a professional trading syndicate in the 1960s. The VSA method works particularly well at highlighting the imbalances of supply and demand.
VSA seeks to establish the cause of price movements, and from that, predict the future direction of prices. The ‘cause’ is quite simply the imbalance between supply and demand in the market, which is created by the activity of professional operators. It is the close study of the reactions of these specialists – market maker professionals, or ‘Smart Money’ – which will enlighten you to future market behavior.
VSA looks at the interrelationship between three variables on the chart in order to determine the balance of supply and demand and the probable near- term direction of the market. These variables are:
- The amount of volume on a price bar
- The price spread or range of that bar
- The closing price on the spread of that bar

The ‘Smart Money’ operating in the markets is very much aware of the emotions that drive YOU and the uninformed traders or investors, in your trading. Why do the members of the self-regulated exchanges around the world like to keep true volume information away from you as far as possible? The reason is because they know how important it is in analysing a market! The significance and importance of volume appears to be little understood by most non-professional traders. Perhaps this is because there is very little information and limited teaching available on this vital part of technical analysis. To use a chart without volume data is like buying an automobile without a gasoline tank.
Price and volume are intimately linked, and the interrelationship is a complex one, which is the reason Volume Spread Analysis was developed in the first place. Ultimately it means that all other factors – including the fundamentals of a company, the management, the strength of the dollar and interest rates, simply aren’t important in your analysis. Ditto for newspaper financial columns, investment journals, broker recommendations and television coverage.
The only truly important consideration for you is what the professional money is doing – that is the only thing that matters.
Volume in FOREX
One of the questions we get asked most often is whether the Trading Package works in the FOREX markets as there is no centralised volume.
The answer is yes! This is because Volume Spread Analysis uses relative volume – the volume on the current bar compared with the volume on the optimum number of previous bars. We know that the vast majority of the volume is professional money, so if the volume we are analysing is only 10% of the actual volume, we can still perform effective volume analysis because we know that the vast majority of that is “Smart Money”.
If you compare the VSA analysis on spot FOREX with the same currency pairs in the currency futures markets, the results are uncannily similar.