

Dynamic risk indicators. Every indicator has been designed with this objective in mind. To help you identify and quantify the risk on each trade, every step of the way. From start to finish. And more importantly – in real time. That’s why we call them dynamic! First comes the risk of taking the trade. Is it high, medium or low?
Then the hard part begins. Managing your trade through the ups and downs of market price action. This is where the dynamic Quantum Trading indicators help you manage your emotions, and maximise your profits, keeping you in, but safe. And all the time, monitoring and measuring risk for you, and then displaying this clearly.
Finally, when it’s time to exit, the Quantum indicators kick in again, signalling the end of trends, or the reversal of a currency, and telling you loud and clear – it’s time to go. And from there – it’s simply a repeat process, over and over again, as you watch your trading account grow and grow over time.
The Currency Dashboard is a package of FOUR Quantum indicators for trading forex :
- THE CURRENCY STRENGTH INDICATOR
- THE CURRENCY MATRIX
- THE CURRENCY ARRAY
- THE CURRENCY HEATMAP
This essential package identifies everything you need in order to highlight and identify currency flows and their associated strength and weakness. In a market that is fast moving and complex, the data is delivered quickly and intuitively across the timeframes.
Now with just four indicators, you will be able to monitor every major currency and every one of the 28 currency pairs across all the timeframes, from just one screen. No constant chasing from one window to another, no multiple screens or crammed workspaces. With this unique dashboard of trading indicators you will be able to see instantly every aspect of currency strength and weakness for currencies and currency pairs in all timeframes and at the click of a button.
How to use the Quantum Trading currency dashboard
Suggestions for using the Quantum Trading currency dashboard – three simple steps!
NinjaTrader 7 – Currency Dashboard
NinjaTrader 8 – Currency Dashboard
If you are a day trader still using time charts, I have bad news for you. Not only are you missing out big time, but you are also making trading much harder for yourself.
Why? Because you’re not trading the way professional traders do. They understand the massive advantages that a tick chart gives them, whether for indices, commodities, stocks, bonds or currencies. Now with the Quantum Tick Speedometer, you can join this professional elite, which puts tick chart trading at your finger tips. The Quantum Tick Speedometer delivers several things simultaneously.
First it converts a time based chart to the equivalent tick based chart in real time, and for all instruments and markets – no more guesswork! Now you can trade with the true momentum of the market. Second, for volume traders it delivers tick based activity to your time based chart allowing you to apply volume price analysis, whilst trading a tick chart. Finally, a traffic light system tells you instantly and clearly whether the market is speeding up or slowing down, as you trade with the activity and not against it.
An introduction to the Tickspeedometer indicator
Matching tick speed to market session, using the tick speedometer indicator
Using the Tickspeedometer to select the correct tick speed for each market
VPA analysis and tick chart trading using the tick speedometer
The histogram and traffic lights of the tickspeedometer indicator explained
Ever wondered how some forex traders just make it look so simple? They seem to have a sixth sense of when the market is about to reverse. Yet when you trade, it’s always a struggle?
Well, wonder no more. Chances are, they’re using a currency strength indicator.
The Quantum Currency Strength Indicator shows you instantly, whether a currency is strong or weak. Currencies reverse from strong to weak and back again, all the time. It is these turning points which offer the most profitable trading opportunities. Spotting them can be hard, but not with the Quantum Currency Strength Indicator!!
The Quantum Currency Strength Indicator, makes it simple, showing you precisely whether a currency is strong or weak in all timeframes. From there, it’s easy. Choose your currency pair, and trade with confidence. No more guesswork. No more uncertainty. No more doubt. Invest in yours now, and join that elite group of forex traders with their own crystal ball.
An introduction to the currency strength indicator
The Quantum currency matrix is a powerful solution to a complex problem. First, it shows you instantly and clearly the strength of the buying or selling in the 28 currency pairs – in real time. Second, with a single click whether this is reflected across the related pairs. Third, whether this applies to both the base and counter currency of the currency pair you are considering. If it is, then the risk on the trade is low, and away you go. Reading the matrix is child’s play.
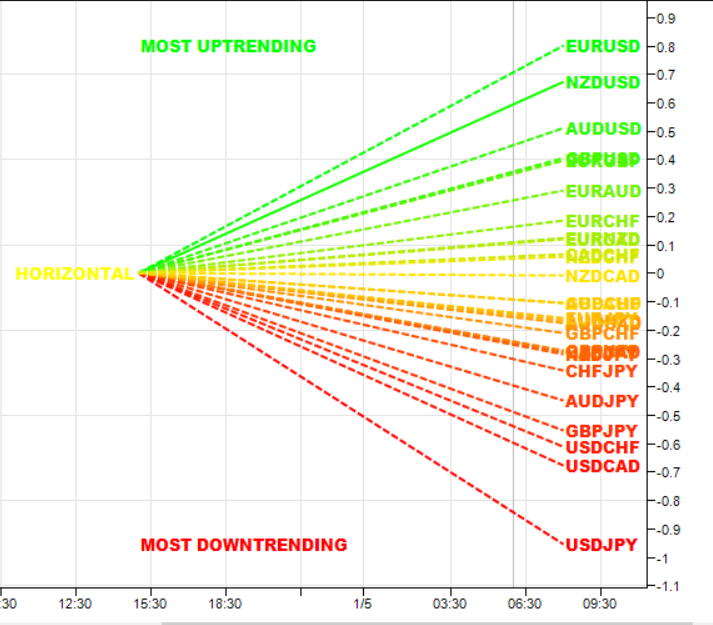
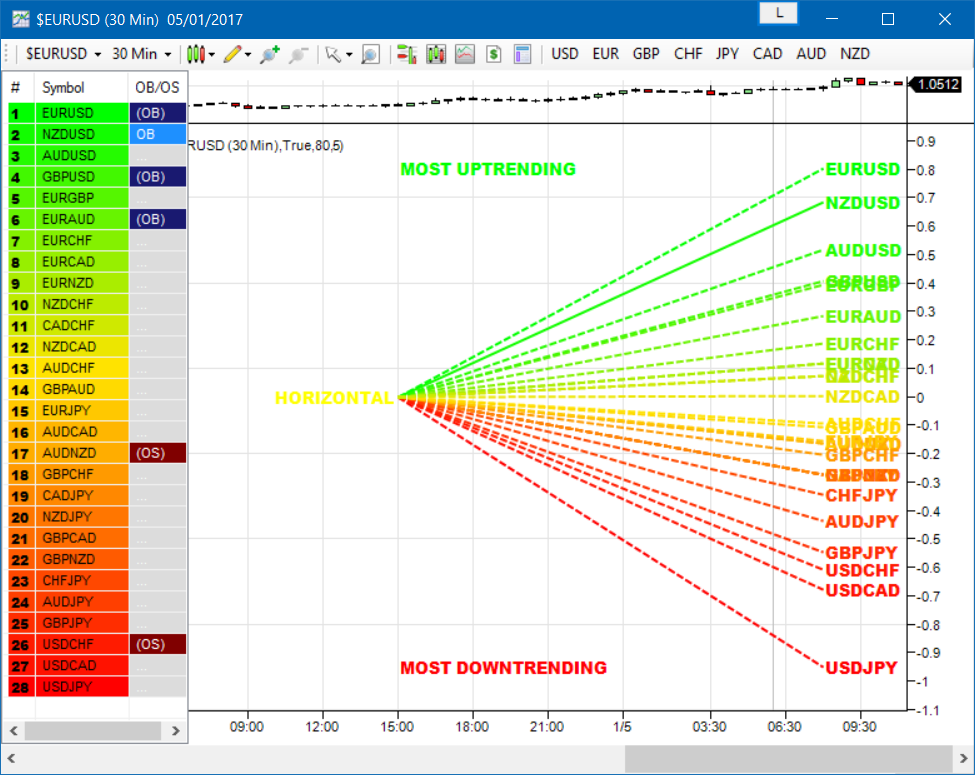
Imagine what it would be like to monitor the performance of all twenty eight currency pairs on one chart. To see instantly which pairs are trending, and if so how strongly. Which are in congestion, and which in a currency complex such as the euro, are diverging from market sentiment. Well imagine no more. The Quantum Currency Array indicator is here and delivers in spades.
It is a powerful and elegant solution to a complex problem. Now in one single indicator you can see which currency pairs are trending strongly, the momentum of this trend, those which are in congestion, and those pairs approaching an overbought or an oversold state.
The pairs are ranked in a table of strength and dynamically color coded for intuitive analysis. Each pair is then displayed as a single line, with the gradient describing the momentum of the trend. In other words the strength of the move. To help further, the indicator then signals those currency pairs approaching an overbought or oversold condition in the ranking table.
And in addition the Currency Array gives you an instant warning of whether the currency you are focusing on is being bought or sold universally. In other words, a heads up to risk.
And last but not least, you can check all twenty eight pairs across all the timeframes within seconds. No more missed opportunities. No need to have hundreds of charts or multiple screens. It is all here. Compact, elegant, instant and clear. The complex sea of forex sentiment that ebbs and flows second by second, all beautifully displayed on one chart.
The Quantum Currency Heatmap delivers the complex information you need as a forex trader – FAST. In fact so fast it displays a total of 252 chart snapshots, on one screen. That’s twenty eight currency pairs in nine timeframes – almost impossible to imagine if displayed in a conventional way. Now, thanks to the Quantum Currency Heatmap, seeing and interpreting this much trading data has never been so easy! No need for multiple monitors, multiple PC’s, crowded screens, or chasing price movement from one timeframe to another and back again.
The Quantum Currency Heatmap does this by systematically displaying the “hottest” and “coldest” areas of the forex landscape using an intutive color coding scheme. It’s like a thermal imagery scanner, but for forex! Much like its sister indicator, the Quantum Currency Matrix, it assigns a rank to each of the 28 currency pairs, but from data crunched across the time horizon. Currency pairs are then ranked vertically and horizontally to describe strength and weakness in two dimensions. The ultimate heatmap of bullish and bearish sentiment in all timeframes, and at the click of a button.
NinjaTrader 7 – Currency Heatmap indicator
NinjaTrader 8 – Currency Heatmap indicator
Most technical indicators uncover and exploit the patterns price each on the charts and make assumptions, suggestions, and predictions of the next price action. However as you can see clearly, price is only half the story. The measure of activity behind price action is key. As a pure technical analysis tool, Quantum Volume Point of Control (VPOC) indicator is mathematical proof that volume is an important factor in determining price action.
An introduction to the VPOC indicator
VPOC for NinjaTrader in action
The Camarilla levels indicator works in all timeframes on both standard and custom charts, and in every market, so can be used to trade stocks, commodities, forex or indices and for both the NinjaTrader 7 and NinjaTrader 8 platforms.
So whether you’re a discretionary trader who prefers swing and trend trading, or a breakout trader who is perhaps more systematic, the Camarilla levels indicator can deliver it all. And to help you when using the indicator we’ve also included some simple messages to guide you as the various levels are approached and tested, including those all important levels for stop loss placement.
Camarilla Levels Indicator for NinjaTrader 7
Camarilla Levels Indicator for NinjaTrader 8
NT7 – Appplying the Live Camarilla Levels
NT8 – Appplying the Live Camarilla Levels
The Quantum Trading Renko Optimiser indicator for NinjaTrader offers a simple, effective, and systematic method in choosing the most effective brick size, and the best part of all – it’s all done with just the click of a button!
Renko optimiser indicator for NinjaTrader 8
Using the renko optimiser for NinjaTrader 8
Renko optimiser indicator for NinjaTrader 7
Using the renko optimiser for NinjaTrader 7
One of the hardest things to do in trading, is to stay in, and take the maximum profit from any position. You know how it goes. You get in and all is going well. Then the market reverses. You get frightened, and close out. What happens next?
Yes, you guessed it – the market reverses again and starts to move fast. Now it’s too late. You have missed out on some great profits, and are left wishing you had stayed in.
That’s why we developed the Quantum Trend Monitor. It does just that. It monitors the strength of the trend. It will help you stay in, when your emotion is telling you to get out. The trend monitor will give you the confidence, not just to stay in, but to take the maximum profit from each and every trade.
An introduction to the trend monitor indicator
Trend monitor indicator for Ninjatrader in action
Trends and trend monitor indicators in action
Adding the trend line to the trend monitor indicator
Fine tuning the trend monitor indicator
All traders know that price is a leading indicator. Yet few traders ever discover how to correctly interpret the start of a new trend, or indeed the end of an old one. To add further complexity, markets spend over 70% of their time in congestion, moving sideways in a narrow range. The traders worst enemy.
What’s the answer? Step forward – the Quantum Trends indicator. With this simple and elegant indicator, dynamic trends are painted for you instantly and dynamically, in real time. In trading any market, you need to be quick on your feet, and the Quantum Trends indicator delivers in spades! But even better, not only will it signal your possible entry and exit, it also signals a market in congestion – equally important. Knowing when to stay out, is just as important as knowing when to get in.
An introduction to the trends indicator
Trends indicator for Ninjatrader in action
Trends and trend monitor indicators in action
Fine tuning the trends indicator
The Quantum Dynamic Price Pivots indicator, could best be described as the Swiss army knife of trading. Power, simplicity and functionality all in one tool. Many traders struggle to identify reversal points based on price action alone. Why? Because you need to have a complete understanding of candlesticks, candles and candle patterns. Well struggle no more!
The dynamic pivot appears once a three candle price pattern is created. This is one of the first signs of a possible change in sentiment, based on the price action alone. A pivot high in an up trend, and pivot low in a down trend. So whether you are trading long or short, the Quantum Dynamic Price Pivots indicator will instantly give you a visual signal to – pay attention! Powerful, yet so simple, and two indicators in one!
An introduction to the dynamic price pivots indicator
Dynamic price pivots indicator for Ninjatrader in action
Another dynamic indicator that works in real time. Are you getting the picture? Trading success is all about taking and making decisions at the live edge of the market – that’s why we call them dynamic. If you are one of those traders, endlessly drawing lines on your charts, and confusing yourself. Stop right now.
Support and resistance is one of the most powerful concepts for the technical trader. These price regions are where the institutions buy and sell, creating these natural levels. It is here, that prices pause, and often reverse, giving two benefits in one. First, a great place to get in, and secondly even more importantly, a place to close out, and take profits off the table!
Now at last, you have a tool to do all the hard work for you – dynamically. Just apply the indicator, and sit back. Put away your drawing tools forever, and let the Quantum Dynamic Accumulation and Distribution indicator do all the hard work for you! Not only does it work dynamically in real time, it also displays the depth of these regions, the number of times they have been hit, and from which direction, giving you something unique – the complete picture of sentiment and depth at each and every level.
An introduction to the accumulation and distribution indicator
The Accumulation & Distribution indicator for NinjaTrader in action
Volatility can be both good and bad. Great for making money fast. Not so good when you’re on the losing side! But how do you know when a market is volatile. Is the price action you are seeing normal for that instrument? And more importantly, what is normal?
The Quantum Dynamic Volatility indicator is designed with one objective in mind. To show you, dynamically volatile price action. You then decide, based on the price action, whether to wait, or take advantage. One of the hardest things to learn in trading, is when to stay out. The Quantum Dynamic Volatility indicator makes this child’s play – keeping you safe. It could almost be called your safety belt!
An introduction to the dynamic volatility indicator
Dynamic volatility indicator for NinjaTrader in action
Quantum USDX
The Quantum USDX gives a more balanced view of the US Dollar, using four equally weighted currencies to calculate an index more relevant in today’s world. Whatever the market or instrument you trade, having a view on the US Dollar is fundamental to your success as a trader.
Quantum JPYX
Forecasting the direction of the Japanese Yen has never been easy – until now! The Quantum JPYX indicator does just that – and all inside your NinjaTrader platform. Add one to your Yen currency chart today and start trading the JPY pairs with confidence.
Quantum EURX
The Euro is the third of our trio of influential currencies in the Forex market, and whilst the dollar index has been available for many years, index for the Euro has been hard to find… until now. The Quantum EURX brings it all to you in your own NinjaTrader account providing an instant view of the Euro against a basket of currencies. If you are trading the Euro, either in a major or cross currency pair, this index will help you make sense of the currency and in turn, related pairs
Quantum GBPX
Have you been looking for a reliable British Pound currency index to aid you in your technical analysis? Finding one in the wild is certainly difficult, until now… Quantum Trading is proud to introduce its official GBP currency index indicator for the NinjaTrader 7/8 platform, the Quantum GBPX!
Add this to your NinjaTrader dashboard and start making more meaningful analysis and more informed trading decisions on various GBP currency pairs.
An introduction to the USDX indicator
The USDX for NinjaTrader in action
An introduction to the JPYX indicator
The JPYX indicator for Ninjatrader in action
An introduction to the EURX indicator
EURX indicator for Ninjatrader in action