vnd_example01

The natural and comprehensive way to see the flow of the Market…

Early detection of the volume clustering within a small price range along with observation of how the volume distributes over time and price are the basic purposes of this add-on. It has various facilities to achieve these goals:

All computations are based on the most recent trades (a group of recent trades of constant total volume hereinafter referred to as the Bracket). The Bracket represents a such quantity of the most recent trades that are amounting to user-specified value in the sum of its volume (see the ‘Bracket Volume Threshold’ parameter). However, even emphasizing in that way on what the market is doing right now the add-on has natural handy tools of showing the past. For instance, such Bracket-based basic concept makes it possible to implement such valuable visual tool as on-chart mapping that has two most interesting forms in this version: the gradient map of volume distribution and the gradient map of average trade size. In addition, the classic bands of volume-based Value Area and Point of Control are available for use.

Some features:

  • Volume Nodes Detector has a special feature of view tracking in the ‘Fixed Scale’ mode. The purpose of this function is to keep the current price within sight on the price chart in fixed scale mode.
  • Volume Nodes Detector utilizes multithreading whenever it is possible. Nevertheless you turn off any unnecessary functions (sub-panes or volume mapping, for example) thus you may rest assured that those functions will not use CPU time. This allows you to combine several instances of the add-on with different settings on the same chart without any marked performance degradation.

So, Volume Nodes Detector overgrew its name and was turned into a versatile tool where all numerous functions complement each other harmoniously.

vnd_anim_1024

General Parameters

1. Bracket Threshold Volume and 2. Reinitialize at Session Beginning

The “Bracket Threshold Volume” parameter limits the volume of the Bracket. As mentioned above, the Bracket is just an abstraction representing the most recent trades that are having in total the volume equal (or not exceeding) the specified value of the “Bracket Threshold Volume” parameter. This parameter has an influence on all parts of the indicator: volume map, volume/tick profiles, volume/tick delta sub-graphs.

The threshold value you should use depends mainly on the liquidity of your chosen instrument. There is no strict rule on this, however there are standard recommendations for intraday traders which might be helpful (at least to be aware on): A simple rule of thumb to define a suitable ‘Bracket Threshold Volume’ value is to set it to 1/10…1/5 of average daily volume of traded instrument. This gives around 10000 to 30000 contracts for 6B and CL, or 100 000 to 200 000 for ES, for instance.

Sure enough, this value has an influence upon the range and sensitivity of the Bracket. The more the threshold volume the wider the range and less the sensitivity to the most recent changes in price & volume.
Thus, using lower Threshold values allows to reveal local short-term volume congestions (or holes in the volume aka low volume nodes, which sometimes more important than congestions).

VND is too customizable, so, what settings to choose is actually dependent on your trading style and thereby on what you’re attempting to track on your chart.

The “Reinitialize at Session Beginning” parameter defines whether the Bracket (i.e. all related volume/tick profiles and calculations of delta sub-charts) be cleared and rebuilt over again starting from the beginning of each session or it should be calculated continuously.
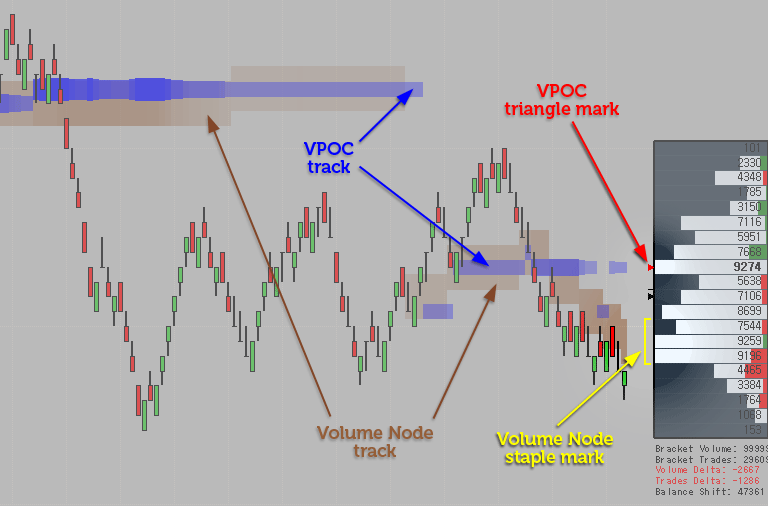
  • Using the ‘Reinitialize at Session Beginning’ = ‘False’ results in continual uninterrupted computations of delta and profiles.
    This option is best to use when you prefer to work with 24H charts (day + night or RTH + ETH on one chart) where the time span between two consecutive sessions is not significant (for example when you trade currencies). You should not use the “False” value along with session templates that infer an appreciable time break (as all of the “RTH” aka Regular Trading Hours session templates, for example).
  • Using the ‘Reinitialize at Session Beginning’ = ‘True’ leads to zeroing of all volume metrics including volume and tick delta at beginning of each session (zeroing of the Bracket). No volume of previous session is involved in delta computations.
    The default value (“True”) suits for the majority of cases, especially when you prefer to work with “RTH” session templates.

3. Number of Ticks of Volume Node

Common Volume-based Point of Control (VPOC) is just one tick wide. So, estimation of the VPOC value is a simple way of volume congestion analysis, but it is not such robust way as to be hoped for, especially when it comes to fast and highly volatile instruments. The Volume Node is a more robust alternative to the VPOC. The Volume Node relates to several ticks instead of just one and represents an area where the most trading occurred (within the Bracket naturally).

You can observe location and migrations of Volume Node by using both the “staple” mark at the side of the multi-profile and the track on price chart.

vnd_vpoc_and_vnode


General Appearance Parameters

  • 1. First-to-Last Trade Of Bracket Line. Sets color and thickness of the line connecting the first trade of the Bracket with the most recent one. Plotting of this line is off by default.
  • 2. Use View Tracking in Fixed Scale Mode. Current price can move off the upper or lower limit of the scope of chart when your price chart is in Fixed Scale mode. Frequent manual adjusting of the scope by dragging the chart scale may appear to be very tiresome at the height of the hot trading session. The “View Tracking” feature allows to eliminate such inconveniences for users.

vnd_fixed_scale

The corresponding toggle button on the toolbar of a Chart window makes it possible to switch the “View Tracking” mode on-the-fly without needing to get into the “Indicators” settings window.

vnd_view_tracking_switcher

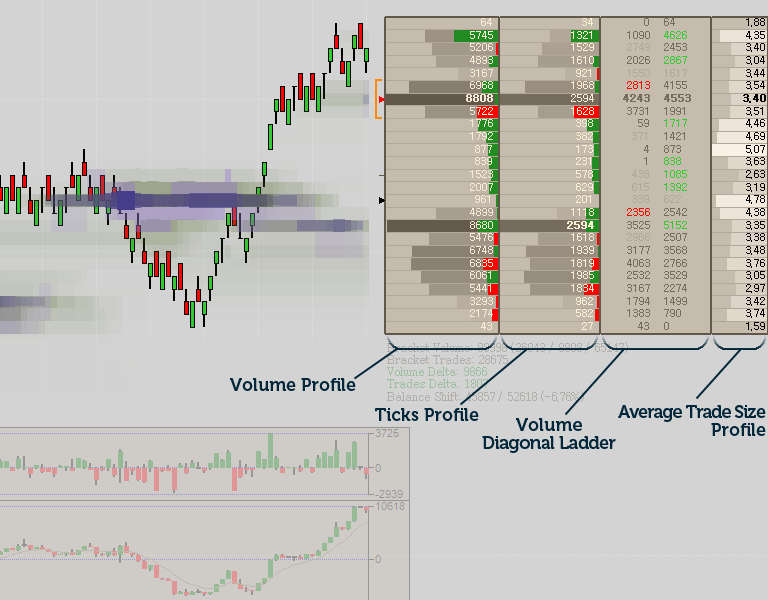
The function of view tracking is smart enough to take into account the height of sub-panes.

When applying two instances of the Volume Nodes Detector to the same chart you can have the “View Tracking” function enabled in both of them without negative consequences. But it is good practice to enable this function in only one instance of the Volume Nodes Detector (in that one that has sub-panes).

3. Value Area. This expandable property allows you to customize visual appearance of the bands of developing volume-based value area: Value Area High and Value Area Low.

Value Area (VA) is the price range in which a specified percentage of all volume was traded within the Bracket.
The “Tolerance Interval” parameter sets this percentage and it is about 70% by default (typical VA). However, this is up to the trader’s discretion.

You can find many sources of information on Volume Profile and classical principles of volume analysis everywhere on the Internet. We can recommend the Peter Steidlmayer’s educational video for a good start.

Multi-Profile

Multi-Profile is a sort of container that can be composed of an unlimited number of profiles (histograms, ladders) of one of four different kinds: Volume Profile, Ticks Profile, Volume Diagonal Ladder, Average Trade Size Histogram.
Each kind of profile/histogram has own properties besides the generic appearance settings.

vnd_multi-profile

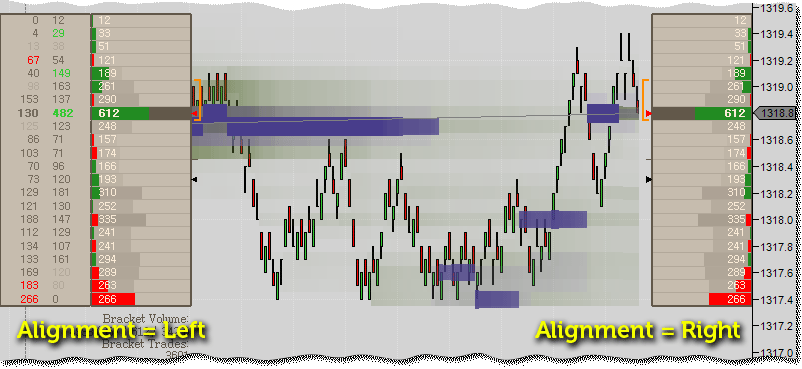
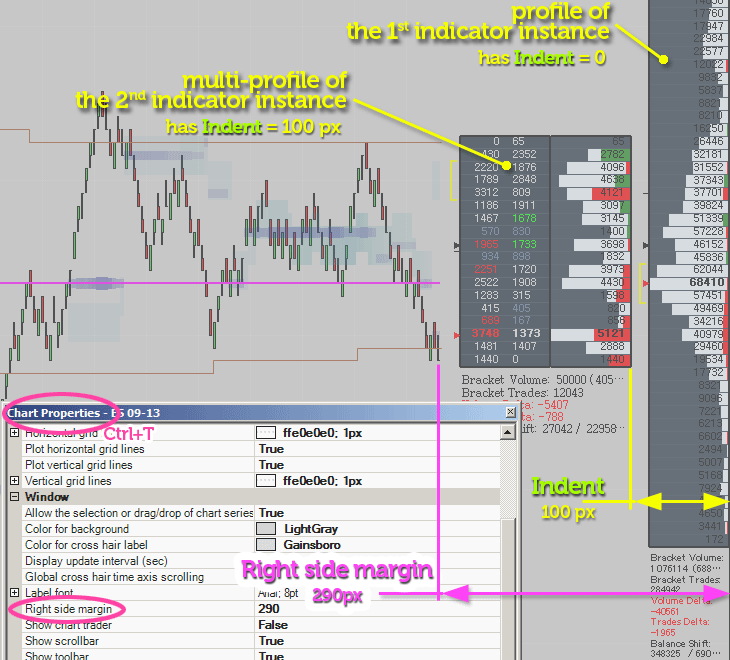
General Appearance Settings of Multi-Profile

  • 1. Alignment. Sets the alignment of the multi-profile block (to the Right or Left side of the chart).

vnd_multi-profile_alignment

2. Indent Size. Sets the amount of indent from the border of the chart.

vnd_indent_and_margin

  • 3. Frame. Specifies appearance properties of the frame. To turn off plotting of the frame outline set the color to ‘Transparent’.
  • 4. Volume Node Staple Mark. Specifies appearance properties of the line of Volume Node mark. To turn off plotting of the mark set the color to ‘Transparent’.
  • 5. Marks Width. Sets horizontal width of Volume Node staple, VPOC and Median triangle marks.
  • 6. Font for Profiles. Specifies font for profile data.
  • 7. Font for Reference Info. Specifies font for the text block of reference info. The reference info block contains supplementary data on certain objective metrics of the Bracket:

Bracket Volume: Total (Above VPOC / VPOC Value / Below VPOC);
Bracket Trades: Total amount of trades;
Volume Delta;
Trades Delta;
Balance Shift: Volume above vs Volume below mid point of the range of the Bracket.

  • 8. Reference Info Formatting. This setting allows to turn off displaying of reference info as well as to choose between two formatting modes: “Place field name and data on the same line” and “Place data under its field name”.

    The second mode might come in handy when your multi-profile area will have appeared to be too narrow.

  • 9. Histograms Constructor. This property item provides an access to the editor of the custom collection of the multi-profile elements. Here you can add new or remove existing histogram or ladder, as well as edit individual settings of any histogram/ladder.

vnd_histogram_constructor

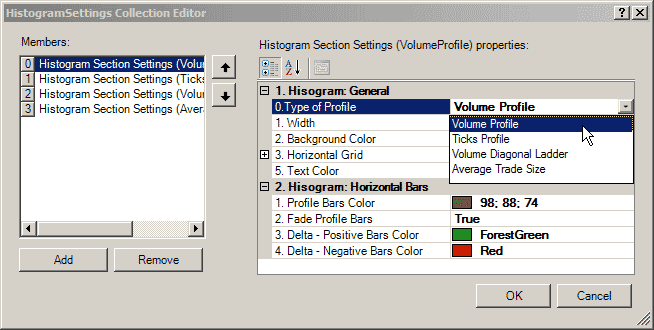
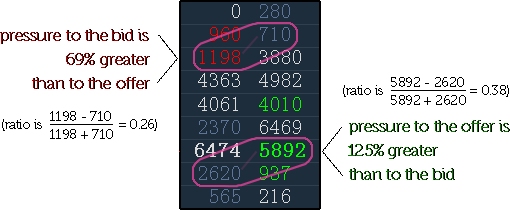
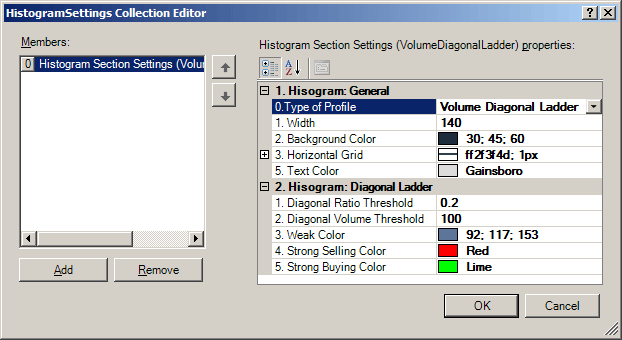
There are currently four types of sections you can choose from: Volume Profile, Ticks Profile, Volume Diagonal Ladder, Average Trade Size (ATS) Profile. Three of them (Volume, Ticks and ATS Profiles) have mostly similar settings because of similarity of visual representation. Volume Diagonal Ladder is a kind of Bracket-based volume footprint (aka bid-ask ladder) that uses a particular approach to coloring the bid and ask values.

Managing histograms:

Volume Diagonal Ladder

This simple bid-ask ladder uses coloring based on “diagonal” ratio between the bid value and the corresponding ask (offer) value. In other words, the bid value is compared with the offer value located right above, and then, if the difference (or ratio) exceeds some predefined threshold, then it means we have a significant volume imbalance between that particular bid and ask. So, such diagonally imbalanced bid-ask pairs will be highlighted by noticeable colors (see the “Strong Selling Color”, “Strong Buying Color” and “Weak Color”).

vnd_diagonal_ladder

All bid-ask diagonal pairs that are not imbalanced will be colored by the ‘neutral’ “Text Color”.
Diagonal Ratio Threshold and Diagonal Volume Threshold parameters jointly define the sensitivity of imbalance detection.

vnd_diagonal_footprint_settings

  • 1. Diagonal Ratio Threshold. Diagonal bid-ask pairs having a ratio greater than the specified threshold are considered as imbalanced. Therefore, the greater the threshold the lower the sensitivity of imbalance detection.

    Examples of relationship between ratio and percentage:
    Ratio 0.1 ↔ if the bid (or offer) value is 22% greater than the offer above (or bid below) value…
    0.2 ↔ 50%
    0.273 ↔ 75%
    0.333 ↔ 100%
    0.429 ↔ 150%
    0.5 ↔ 200%
    0.6 ↔ 300%

    Note: All numbers are given just for reference. Don’t get too stuck with any numbers and exactness.Remember, the Market is very visual. And this tool is also a visual tool in the first place. The renunciation of an absolute certainty and exactness in trading is the first step to the peace of mind and profitability.

  • 2. Diagonal Volume Threshold. Diagonal bid-ask pairs with the bid or ask value less than the specified threshold are not involved in the process of imbalance detection and, thus, are always colored by the Text Color.

Volume Maps & Tracks

To track price levels of volume congestion you can use both VPOC Track and Volume Node Track. In addition you can use such order-flow mapping tools as Volume Profile Map and Average Trade Size Map. All tools has similar setting and computation modes.

VPOC Track

As it was mentioned, Volume Point of Control (VPOC) is the price level where the most volume was traded within the Bracket.

  • 1. Mapping Mode.
    • Do not plot.
    • Plot as simple line.
    • Based on VPOC Value / Bracket Volume ratio.
      In this mode VPOC Track is plotted as a one tick wide stip with the ratio-dependent opacity. The closer the (VPOC Value/Bracket Volume) ratio is to the user-specified value of the Upper Limit of VPOC Value Ratio parameter, the more opaque the track will be.

      Or simpler: the more volume, the more opacity.

    • Based on VPOC Value / Average Volume Per Price Tick ratio.
      This mode is basically similar to the previous one with the difference in the ratio used for variation of the opacity. The closer the (VPOC Value/Average Volume Per Price Level) ratio is to the user-specified value of the Upper Limit of VPOC Value Ratio parameter, the more opaque the track will be.

      Or simpler: the more volume, the more opacity.

  • 2. Color. Sets the reference color for VPOC track.
  • 3. Upper Limit of VPOC Value Ratio. This setting is available only for the last two of mentioned modes.
  • 3. Thickness. This setting is available only for “Plot as simple line” mode, and hence defines the thickness of VPOC line.
  • 4. Contrast. This parameter allows to adjust contrast between high and low volume areas of VPOC Track. If less than 1 → less contrast; more than 1 → more contrast (Default = 2).

Volume Node Track

As it was mentioned, the use of Volume Node Track instead of VPOC Track might appear to be more appropriate way for an analysis of volume congestion when working with fast and volatile instruments like GC or CL. Volume Node (VNode) relates to several ticks instead of just one and represents an area within the Bracket where the most trading occurred.
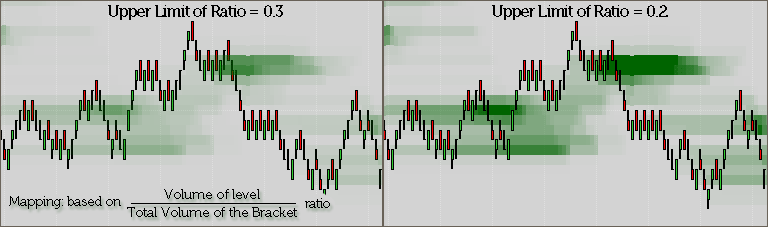
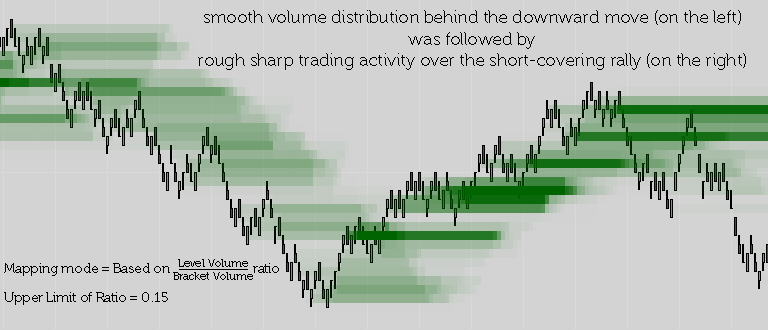
  • 1. Mapping Mode.
    • Do not plot.
    • Based on Node Volume / Bracket Volume ratio.
      In this mode VNode Track is plotted as a several ticks wide stip (depending on “Number of Ticks of Volume Node”) with the ratio-dependent opacity. The closer the (Node Volume/Bracket Volume) ratio is to the user-specified value of the Upper Limit of Node Value Ratio parameter, the more opaque the track will be.

      Or simpler: the more volume, the more opacity.

    • Based on Node Volume / Average Volume Per Price Tick ratio.
      This mode is basically similar to the previous one with the difference in the ratio used for variation of the opacity. The closer the (Node Volume/Average Volume Per Price Level) ratio is to the user-specified value of the Upper Limit of Node Value Ratio parameter, the more opaque the track will be.

      Or simpler: the more volume, the more opacity.

  • 2. Color. Sets the reference color for Volume Node track.
  • 3. Upper Limit of Node Value Ratio. As always, you should not be getting too stuck with exactness or any precise numbers. You need to get play with the limit value to find out one that suits your objectives. The usable value of the parameter may vary considerably depending on traded instrument and chosen mapping mode.
  • 4. Contrast. This parameter allows to adjust contrast between high and low volume areas of VNode Track. If less than 1 → less contrast; more than 1 → more contrast (Default = 2).

Volume Profile Map

This kind of order-flow mapping implements shading of all price levels within the Bracket in accordance with the volume traded on each particular level.

  • 1. Mapping Mode.
    • Do not plot.
    • Based on Level Volume / VPOC Value ratio.
      In this mode the opacity of each price level area depends on (The Volume of the level/Current VPOC value) ratio.
    • Based on Level Volume / Bracket Total Volume ratio.
      In this mode the opacity of each price level area depends on (The Volume of the level/Total Volume of the Bracket) ratio.
  • 2. Displaying Mode. Can be Normal or Inverse.The Normal mode means the familiar shading approach: the more volume, the more opacity.The Inverse mode is an experimental mode that was added as a way to lay emphasis on areas with low volume.vnd_inverse_mapping
  • 3. Color. Sets the reference color for Volume Map.
  • 4. Upper Limit of Node Value Ratio.vnd_upperlimit_effect
  • 5. Contrast. This parameter allows to adjust contrast between high and low volume areas of Volume Map. If less than 1 → less contrast; more than 1 → more contrast (Default = 2).

Tip

What is the difference between these two mapping modes in practical applications?
The opacity of map sectors for a given time (given price bar) is normalized relative to the VPOC value of the same time with the mapping based on Level Volume / VPOC Value ratio. Since the VPOC value is dynamic, such king of volume map shows us how the volume is distributed within the Bracket.

vnd_vmap-vpoc_mode

At the same time, the second mapping mode is based on volume normalization relative to the total volume of the Bracket. While being destined to show distribution of volume traded, such approach reveals also how a character of distribution was being changed over time.
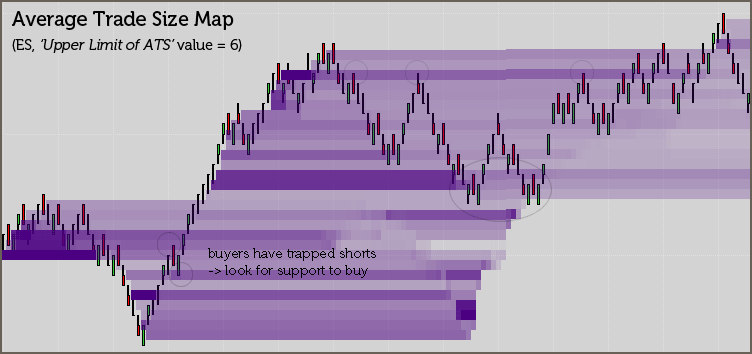
vnd_vmap-bracket_mode

Average Trade Size Map

This is the experimental kind of order-flow mapping.
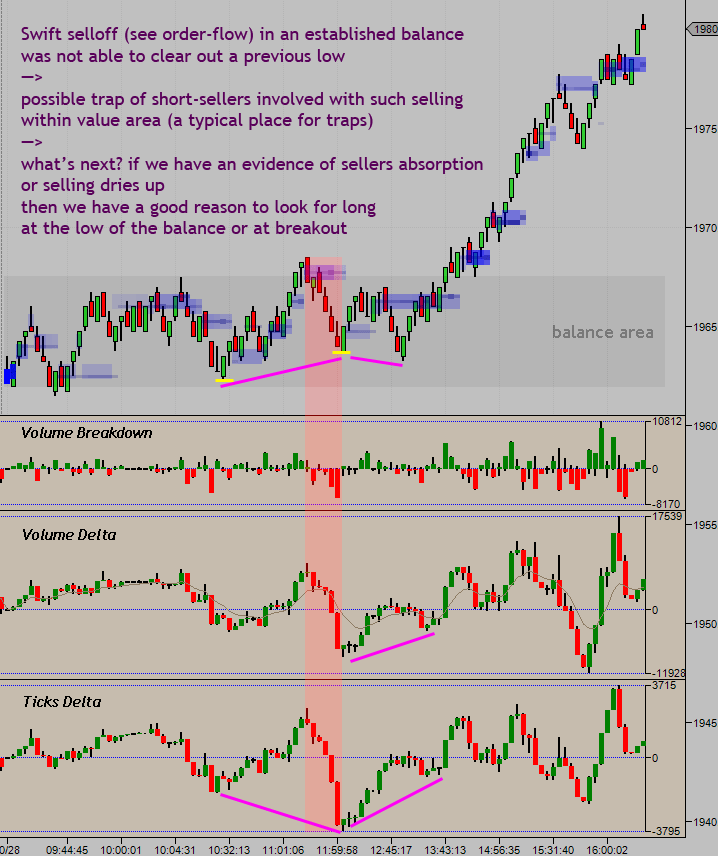
vnd_ats_mapping

Sub-Panes

Sub-Panes are serving to display up to three similar order-flow metrics in a traditional form of candlestick charts.

Those metrics are:
— Bracket Volume Breakdown,
— Bracket Volume Delta,
— Bracket Ticks Delta.

As you may have guessed, all of them are calculated for the Bracket.

1st — Bracket Volume Breakdown

Bracket Volume Breakdown shows how the volume delta (buying versus selling pressure) of the Bracket was varied on each particular bar separately.

2nd — Bracket Volume Delta

Bracket Volume Delta shows the volume delta accumulated for the Bracket.

Calculating the cumulative delta for the Bracket makes it similar to an oscillator-like indicator.

3rd — Bracket Ticks Delta

Bracket Ticks Delta shows the ticks delta accumulated for the Bracket — the difference between the total number of trades at offer and the total number of trades at bid within the Bracket. It also works like an oscillator. So you can use both volume and ticks delta to reveal divergence/convergence between price and order-flow.

vnd-price-orderflow-divergence