

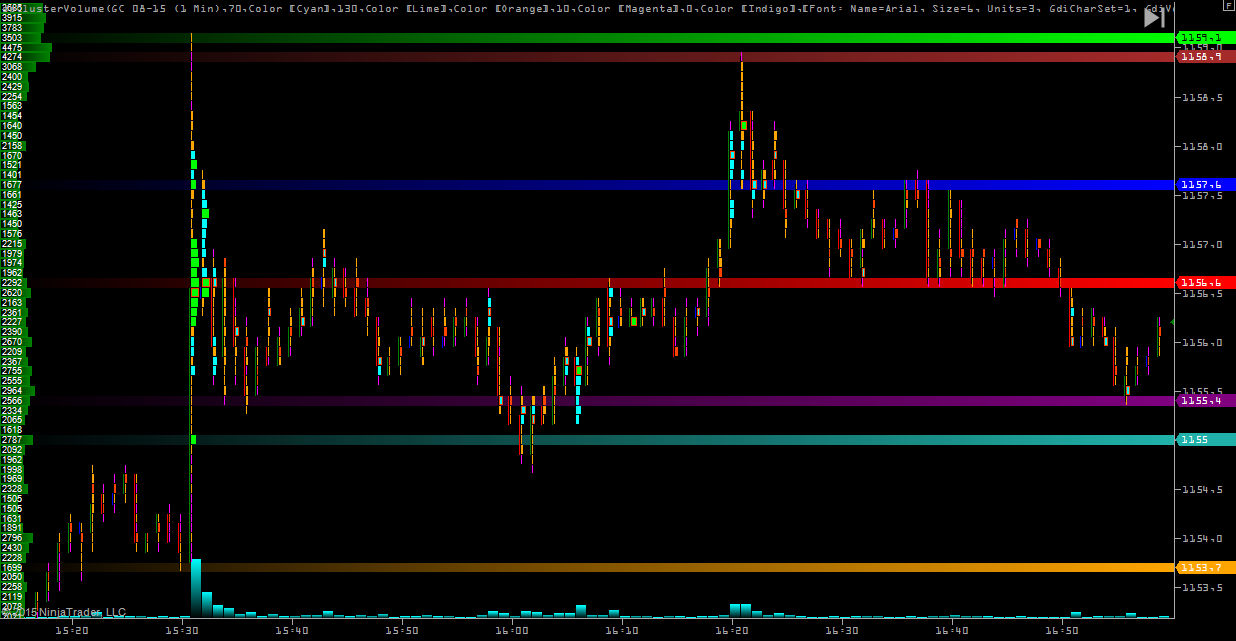
Volume analysis is one of the most really impartial method of technical assessment that gives opportunity to reveal and specify the levels of support and resistance, to estimate trend reaction(value or volume) or additionally confirm existing price model.
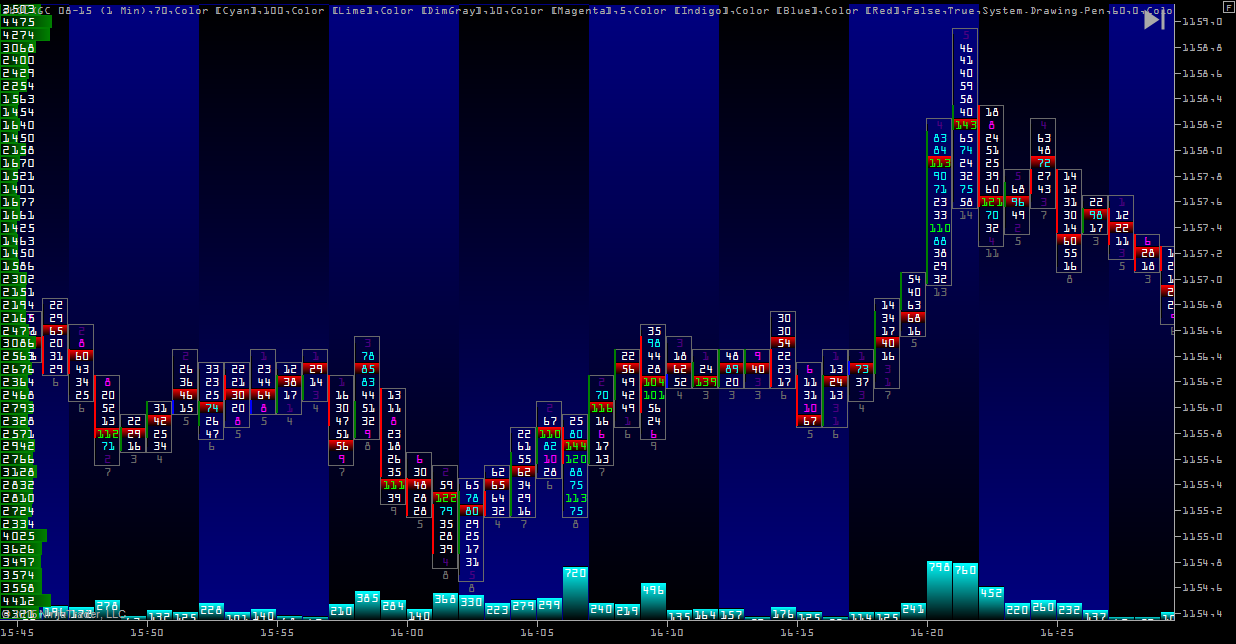
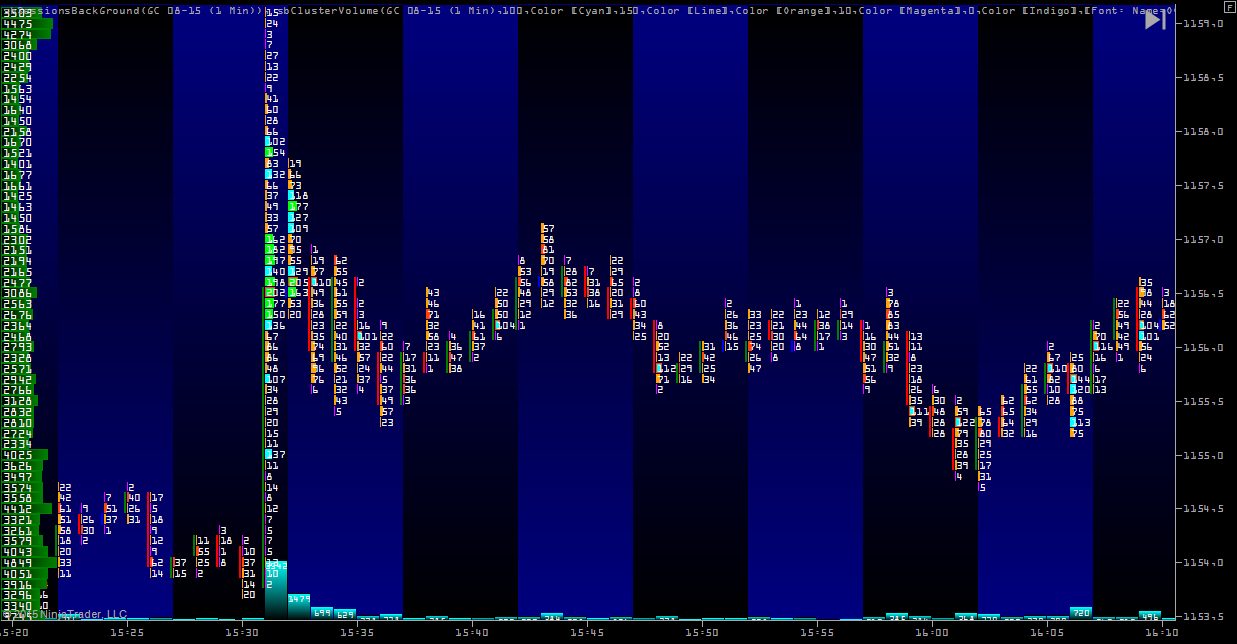
ClusterVolume Indicator allows to penetrate volume clusters,i.e. summary volume traded in current bar at current price. This indicator lines up the clusters in to a bar chart and changes the whole graph to a set of bar charts.
The indicator helps to identify promptly the assessment of volumes in consolidation on the level of support/resistance in the moments of price reversal. So trader can undoubtedly use this information very favorably.
There are integral trading systems based on analysis of volumes. So by means of such method of analyses some traders recognize accumulation of position by “smart money” and determines possible further price direction from the flat, other traders identify trend volume or definite levels, while others with the help of cluster volumes estimate the maximum precision for entrance in the market and reasonable stop decrease until 2 for 6 ticks on future markets.
Cluster graph provides analysis on every timeframe thus it doesn’t matter what type of trading you’d like to choose: scalping, daytrading, mid term trade (holding the position from few days to a week) or long term position trade.
This kind of indicator is more suitable for those trading decisions based on the absolute values of the clusters.
The indicator allows you to customize the color designation with a maximum capacity of ticks in a bar, the number of ticks in the cluster, as well as, most importantly, the color and the size of the clusters for different values of volume (maximum, minimum, and different ranges of variation of volume in the cluster) that are important for making trade decisions.
Now, a quick glance at the chart, you will need to identify places where large amounts, visually assess the rate of their occurrence and relative value.
A large number of strategies are based on levels / areas of support and resistance. The market situation can change very quickly, which often leads to a complete rebuild levels. Introducing you a handy tool to draw horizontal lines. Now, the line became easy to use and intuitive. Each line has a label on the scale of prices, and you know exactly at what price level it is drawn. You can add to a chart or move the line with two clicks of the mouse. A couple of clicks and you have changed the color of the line for one of the colors in the palette. Each line has a width of 1 tick, and used together with indicators or Cluster Volume Cluster Chart is very easy to see exactly which volumes were at a given price in the past. Each line can be configured to sound an alert when you touch the price level on which the line.