OFA Software
What makes the market tick? The trades that get struck at the market auction. Price can’t move without traders getting filled. Now you can see which side is winning the fight. Get on the right side of the market.
Discover the order flow trading features that visualize data in a whole new way. You’ll discover how to successfully trade using order flow analysis in commodity futures, equities, currencies, bond markets, and much more.
Flat-out Phenomenal, Groundbreaking,
Weapons-Grade Technical Analysis
Order Flow Algo™ is the next generation of technical analysis. Built out of a need to see beneath price movement – to see why price was moving. The program aggregates millions of trades into useful visualizations that enable you to see how buyers and sellers are striking into the market auction. OFA reveals market sentiment and shows you whether buyers or sellers are winning the battle. This is not your average TA from the 1990’s.
OFA is optimized for highly liquid markets – where the action is.
Framework
The OFA framework is a toolkit of optimized order flow and volume visualizations. Time and sales data – which is impossible to decipher in its raw form – instantly transform into customizable graphic displays. For decades retail traders have relied on indicators based upon historical data. The OFA framework changes the game to allow you to see the conviction of market participants in the moment. OFA is the engine that makes everything run within the Order Flow Algo toolset. Time and sales data are aggregated using our proprietary algorithms and instantly displayed through clear visualizations.
OFA renders financial trade data in an organized manner, revealing a context for price movement that you don’t get with traditional indicator models. OFA extracts only data from the market auction moving price up or down, revealing patterns in the activity that leads to a move in price. The framework can apply to any market – futures, commodities, currencies or your favorite instruments.
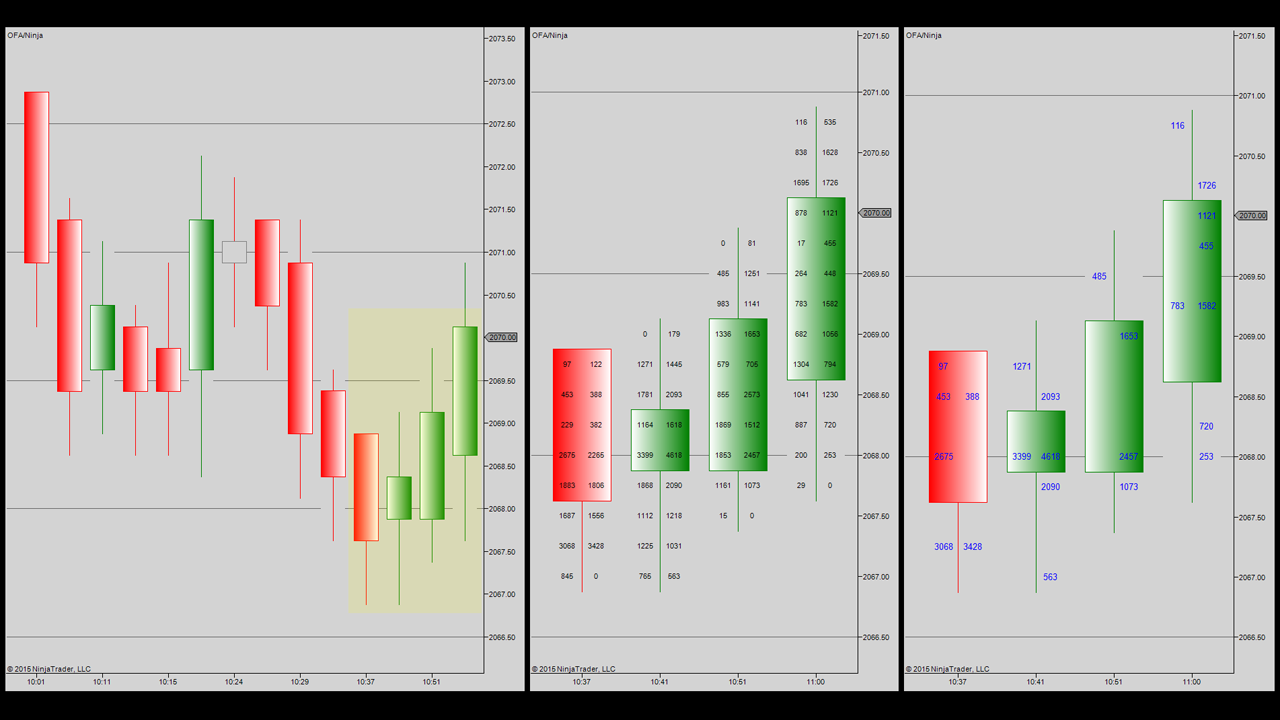
Volume Profile Analysis
Build your trading strategy with Volume Profile Analysis. The VPA provides an optimized view of volume at price. It is a powerful tool to uncover market sentiment as it happens. Find prices that more traders are likely to be active around or levels where the market is saying “no thanks”.
The volume profile elements include:
- Volume bars at price – aggregate trades completed at each price level (reveals activity based on the flow of orders at each price, not on time periods)
- Distribution of price – the volume of trades at different price levels (reveals current buying and selling sentiment)
- Volume point of control (VPOC) – the single most traded price level in a distribution curve (reveals price level that acts like a magnet)
- High volume area (HVA) – price levels with highest trade activity (reveals a fair price where buyers and sellers believe they can make money)
- Low volume area (LVA) – price levels with low trade activity (reveals price levels that most traders believe they should stand aside)
- Value area – a region representing 70% of volume at the VPOC (reveals price levels where most of the period’s trading will likely occur)
- The auction finish – a low volume region where price is unlikely to stay (reveals where buyers and sellers have no interest rotating price to establish a new fair price)
Drag-and-drop selected profile periods to analyze order flow activity during events like price swings, trends, or congestion areas. See how current market activity compares to previous trading around the same price level. Enjoy incredible flexibility to analyze trade activity without being stuck to specific time periods.

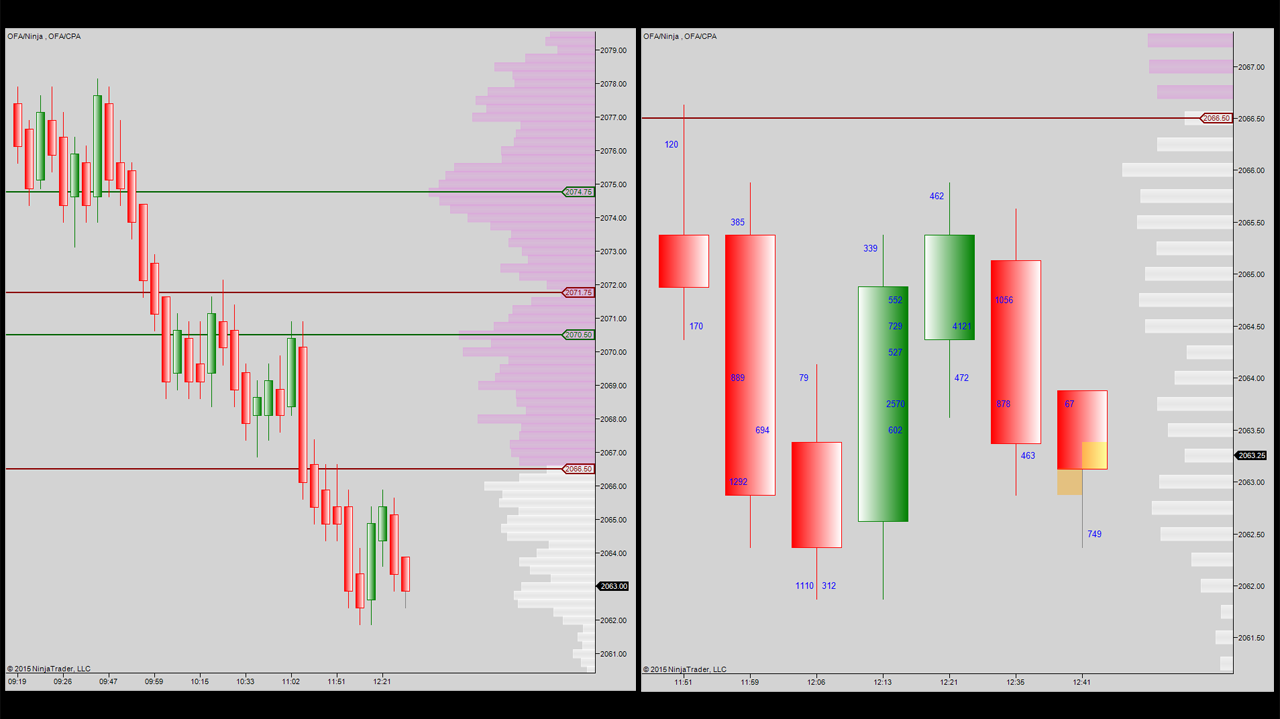
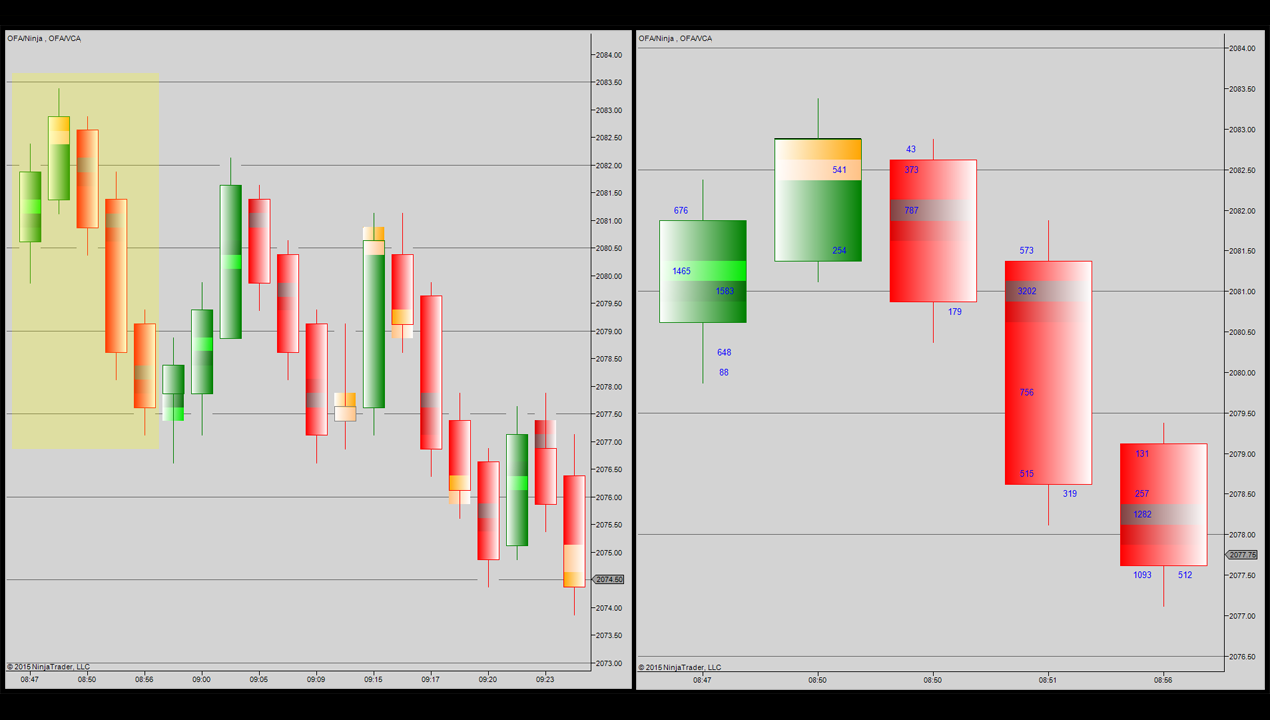
Volume Cluster Analysis
For the trader looking for quick-turn opportunities, the Volume Cluster Analysis helps get on the right side of the market. The VCA aggregates thousands of time and sales data points for the bid and offer as they are printed, revealed as volume bars at price. Used to uncover what the market sees as fair value, the VCA helps prevent being trapped at levels that institutional traders see as unfair.
The VCA depicts market sentiment. Which side is the driving force that moved price? Select a range of days, a single trading period or a swing high/low area, then compare the profile to current market activity. See whether buyers or sellers have more commitment.
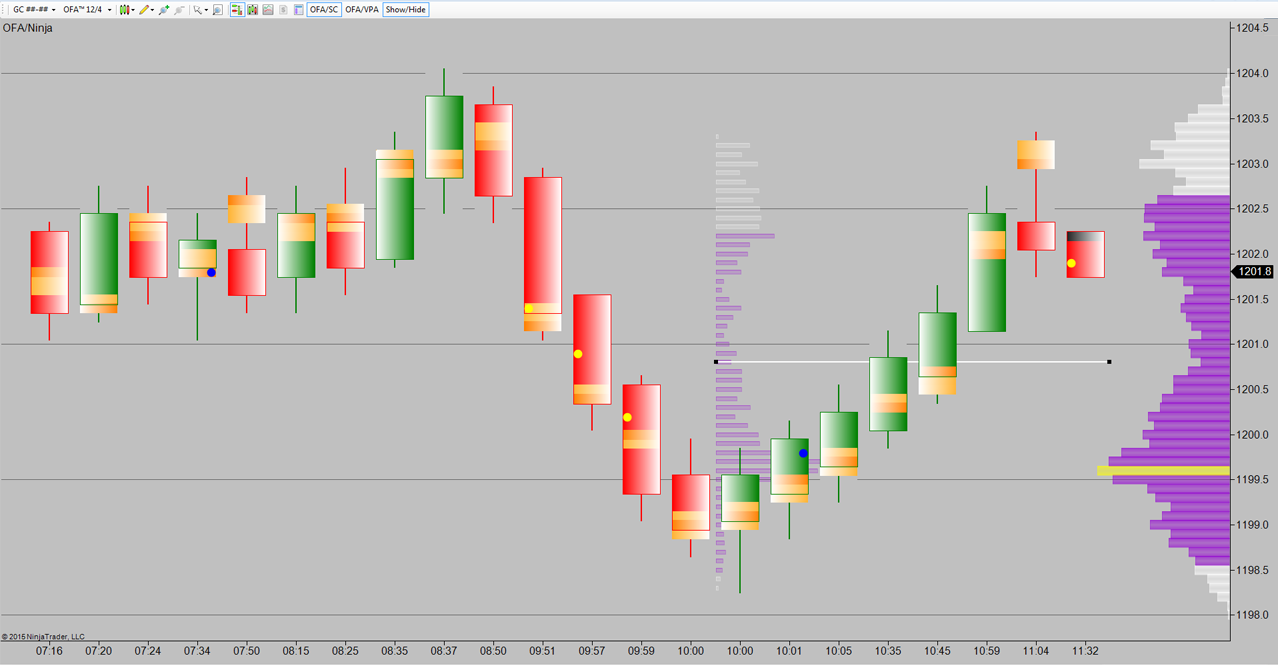
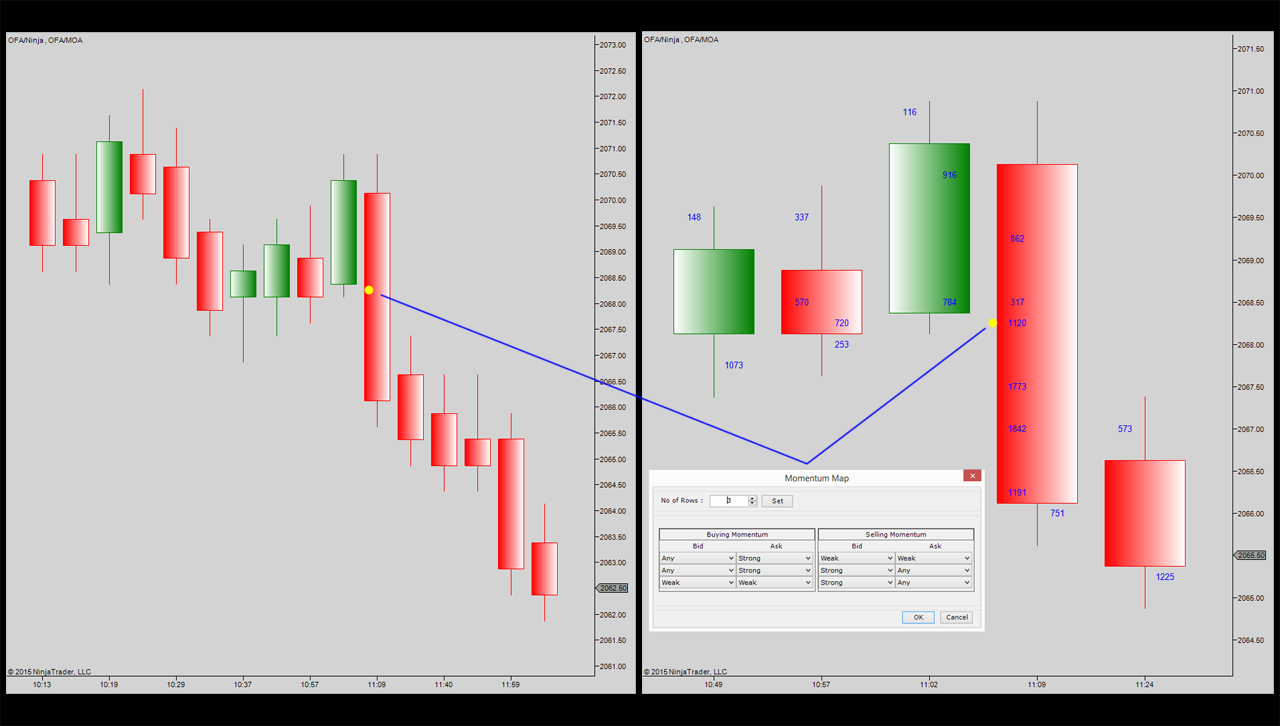
Momentum Analysis
If you think there will be a strong move, the Momentum Analysis tool is for you. The MOA is an easy-to-read aggregation of printed trades executed into the bid or the offer. It reveals whether the market is likely to move price in one direction or the other, uncovering patterns that help you anticipate imminent directional moves. Which side is attacking and which side is relenting? The MOA allows traders to visualize the activity in a way that can help improve trade timing.
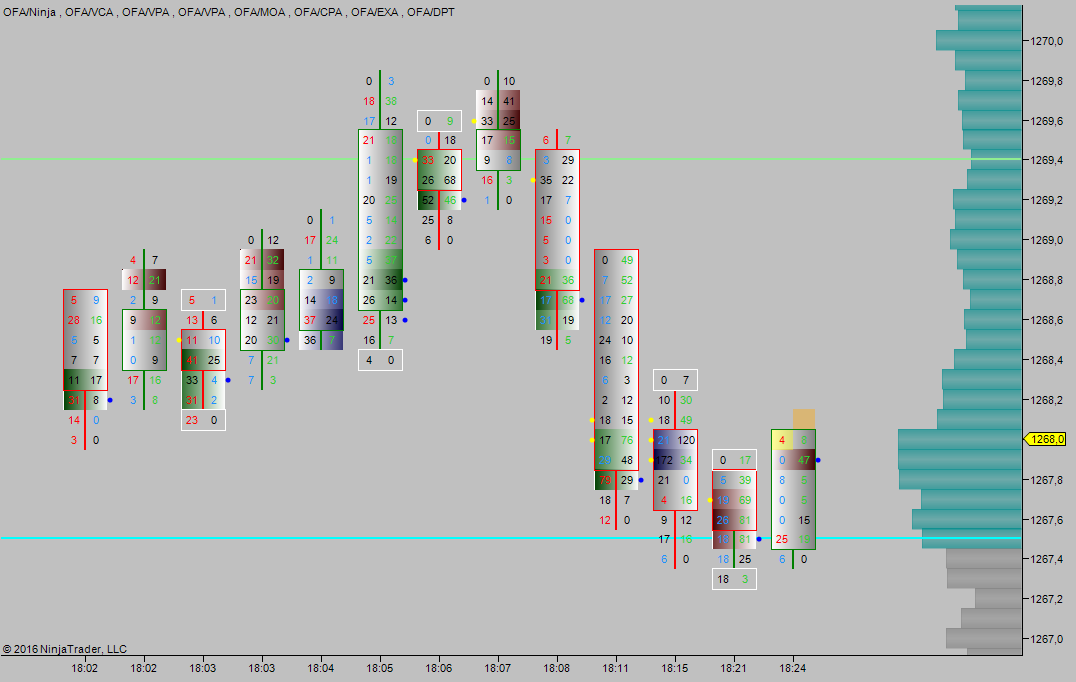
Exhaustion Analysis
Eventually, all trends hit a point of exhaustion – a level where one side gives up and the other side rushes in. These events inspired the development of the Exhaustion Analysis tool. The EXA depicts weakness as price moves toward a support or resistance level. As strength withers to weakness, the EXA uncovers where the market may see bids go weak and offers go strong or vice versa, indicating a reversal may be imminent.

Composite Profile Analysis
Composite Profile Analysis gives you a longer-term view of market sentiment. The CPA provides a snapshot of trading volume for any trading period you select, displayed at price. Use daily, weekly or monthly profiles to see where liquidity is strong.
Target specific time periods during a trading session. Did buyers have strong conviction between 8:30 and 10:00 a.m.? The CPA tool is useful to determine the orientation of the market during specific periods, and helps to see when prices have been accepted or rejected by professional traders.