The Easiest Way Possible To Let Your Profits Run With The Institutions
With the Orderflow Print Suite You will no longer second guess your abilities to trade and make a consistent income from the markets. Because you’ll be armed with universal strategies and tools for day trading or swing trading futures, forex and stocks on any timeframe, and for any trader type.
Stop Trading Against The Institutions
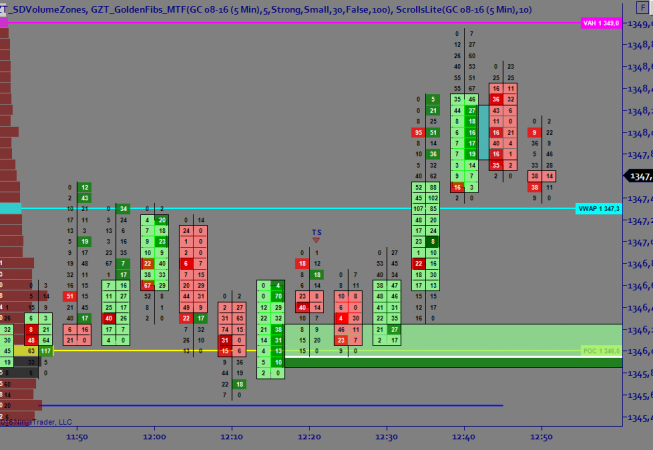
Orderflow Print removing unnecessary trading hype and provides what matters most, institutional “Market Orderflow Print & Volume Profile”.
By looking inside each price bar to identify bid/ask orderflow print and volume profile, you can take precision entries and exits using the internal view of the market. And witness what the big players do to trade against the retail public.
Watching institutions key order flow intell allows you to trade right alongside them, without getting trapped against their trade decisions. With true market orderflow print and volume profile, you will know in advance where to trade and where not to trade — so you only trade when the risk is lowest and the rewards are highest.
The Orderflow Print Suite Gives You 5 Tools In One:
MARKET ORDER FLOW PRINT & BID/ASK IMBALANCES
- See true order flow in each price bar so you can see the executed order flow rather than guess what’s happening between buyers and sellers. This improves entry and exit strategies because it shows real time orders being executed in each price bar. Making it easier to spot the best locations to limit risk, and let profits run during a trade.
VOLUME PROFILE SUITE (3 tools in 1)
- Bar Volume Profile — Tracks volume in real time. This helps improve entry techniques by showing volume shifts intra-bar. It also helps improve trailing stop management because you can let winning trades run longer when volume supports the direction of the trade.
- Composite Volume Profile — Tracks institutional value and sentiment. This helps identify the macro view of daily volume and value. This will show you where the institutions are setting the environment for the day and maps out value areas important for directional sentiment.
- Manual Volume Profile — Allows you to create custom profiles around areas of trading interest. Giving you the flexibility to draw custom volume profiles at areas you’re planning on trading, while giving you inside volume data for your execution strategy.
BID/ASK SUPPLY & DEMAND ZONES
- Locate true supply and demand levels driven by market orderflow print imbalances (NOT SUPPORT & RESISTANCE). This shows you where the market has been deemed cheap (demand) or expensive (supply) so you can buy and sell at the correct locations set by the bigger players.
TRAPPED TRADER SIGNALS
- Identify buy and sell signals driven by exhausted order flow. So you can get into a trade on the specific bar that offers the lowest risk due to trapped order flow.
DELTA DIVERGENCE SIGNALS
- Identify buy and sell signals when price moves in one direction but the (net) change in orderflow is signaling that the order flow does not support the directional move. These ‘divergent’ signals can help you avoid fake-outs or false moves while also signaling exhaustion at key levels that are crucial for timing entries and nailing exits.
SDVolumeZones Software
- Supply & Demand Orderflow Imbalances
- Zone Volume Profile Analysis
- Multi-Time Frame Execution
- Price Action Pattern Recognition
- Market Structure Interpretation
- Using Algorithms and Filters to Reduce Market Noise
- Picking More Profitable Trade Locations More Often
- Risk Reduction While Exponentially Growing Your Equity Curve
- Learning Where Professionals View the Market as Cheap or Expensive
- Analyzing Leading Information While Becoming a Hard Right Edge Trader
GoldenFibs Software
- The 6 pillars of Fibonacci Sequencing
- Using over 540 algorithmic variations of multiple time-frame analysis
- Dynamic levels of only major Fibonacci support and resistance
- Seeing major turning points in advance based on market structure
- Identifying expanding and contracting volatility that shifts price action
- Indicator settings based on trader preference and market requirements
VelocityMomoDIV
- The VelocityMomoDIV acts as a hybrid momentum indicator solving multiple requirements in one tool
- It displays immediate momentum (fast) and long-term momentum (slow) all in one clear location
- It measures momentum over multiple time-frames, using MACD BBs & MTF Velocity Cycles
- It makes it all clear and not confusing, while freeing up chart real estate by removing the need for more indicators
- It displays indicator confluence so traders can easily identify high probability trading conditions.
- It automatically detects single and double divergence for trade setups and trade filters
- It displays price excursion so you know if your trading at the extremes
- It makes momentum trading decisions clear and easy
Fractal Converter
The perfect tool to accurately identify and test the correct time frames to trade. The Fractal Converter:
- Quickly converts linear (time-based charts) to non-linear (volume/volatility-based charts) – giving you the correct chart time frame based on market conditions (not static data)
- Immediately identifies when volume and volatility changes happen – telling you when to test and adjust your trading system based on current market technical’s
- Easily identifies multiple time frame conversions – helping you combine and use the correct multiple time frames based on statistics (and not guessing)
- Provides conversions for FOREX & Futures – Helping you allow for multiple asset conversions if you trade both types of markets
- Tells you when to test your strategy on current and new time frames
- Identifies what time frame to create your trading strategies around based on your type and preference to market speed


