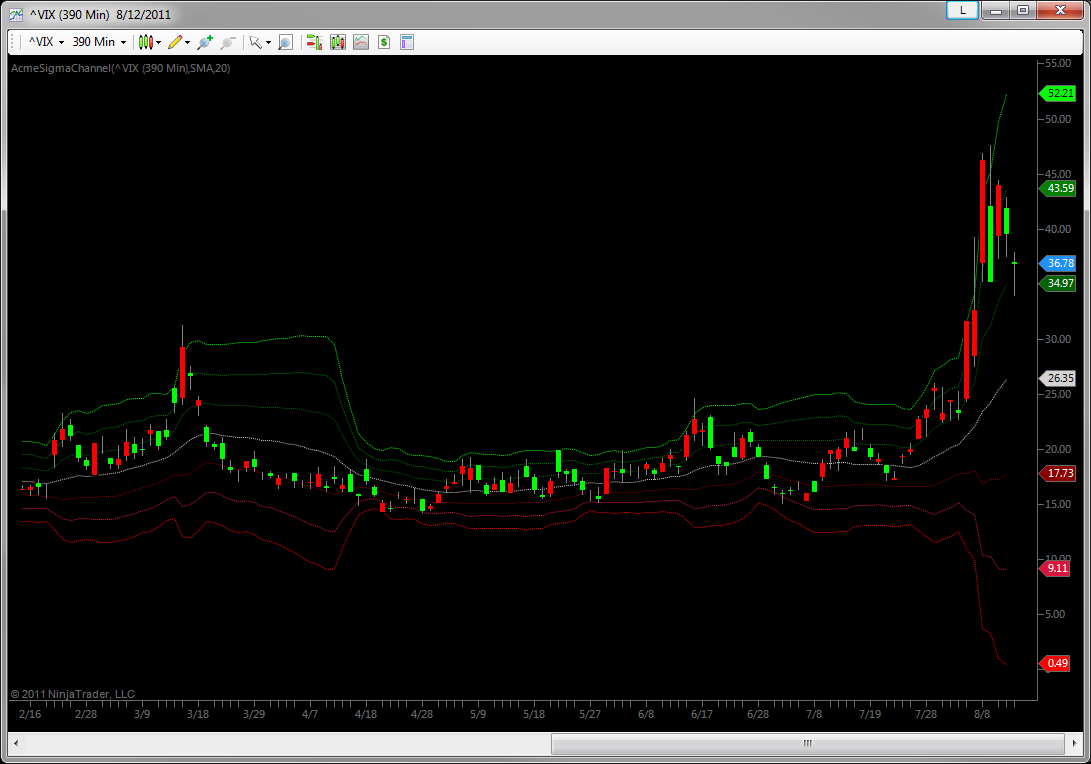
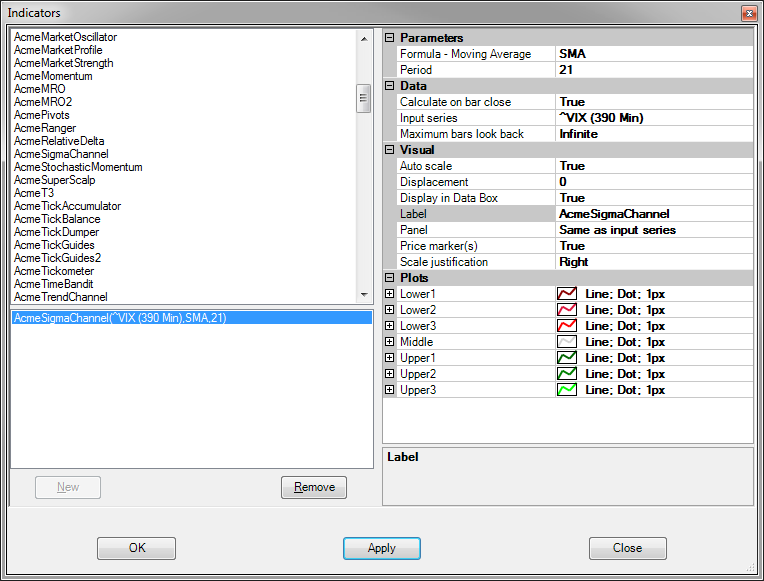
Sigma Channel
The Sigma Channel is an adaptive, 6-sigma range, on-chart indicator similar to the Bollinger Band study with which many are already familiar. You can use this indicator on any instrument, and on any time frame, similar to how you might use the Bollinger Bands. However, the Sigma Channel indicator gives you several moving average options and provides one additional sigma level. In fact, we developed this indicator with the VIX in mind. Many traders watch the VIX intraday as well as on a daily basis as it provides another real-time sentiment data point. Since the VIX is a naturally mean-reverting instrument, that makes an indicator such as the Sigma Channel a perfect fit.
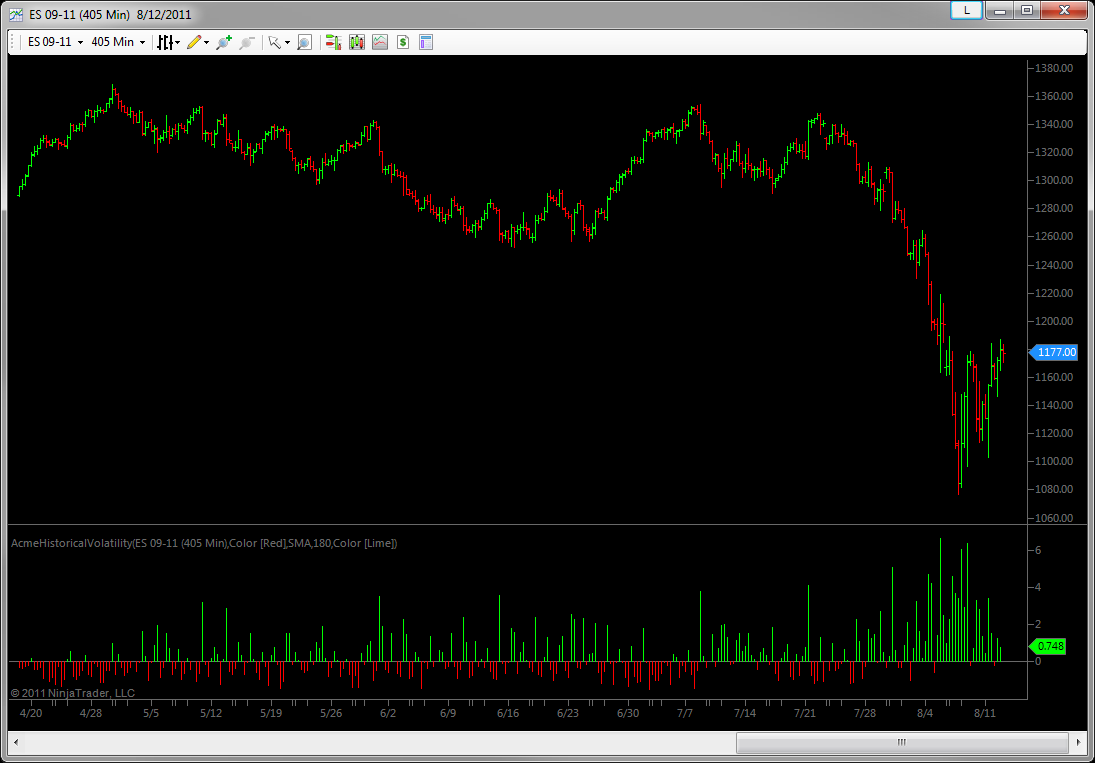
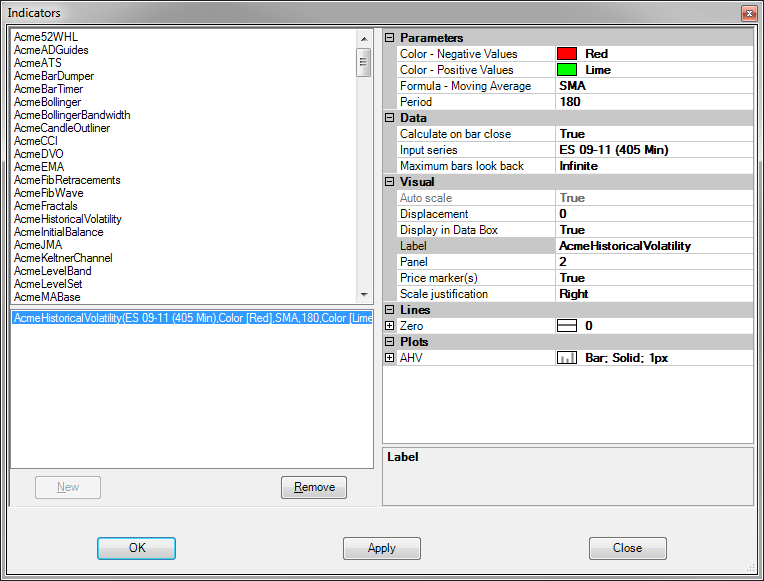
Historical Volatility
The HV is a bottom-panel indicator that can display an unbounded number of sigma (aka standard deviations), and is appropriate for any instrument on any time frame. It displays two key pieces of information:
Values greater than zero represent how many sigma (standard deviations) more volatile the bar range is as compared to the number range of the bars you specified in the Period parameter. Higher and/or extreme values confirm higher volatility, and may signal a mean-reversion event in the near future.
Conversely, values below zero represent how many sigma the bar range is below the mean of volatility. As positive extremes often portend a retracement to a mean, an extended series of negative values confirm strong trend is in place (pretty easy to see in price also). More importantly, a shorter series of negative extreme values (very low volatility) may portend more volatility soon.
The HV has only a few parameters. The colors of the positive and negative values, the type of moving average to be used to calculate the mean and the number of bars used – the Period – in that moving average calculation.
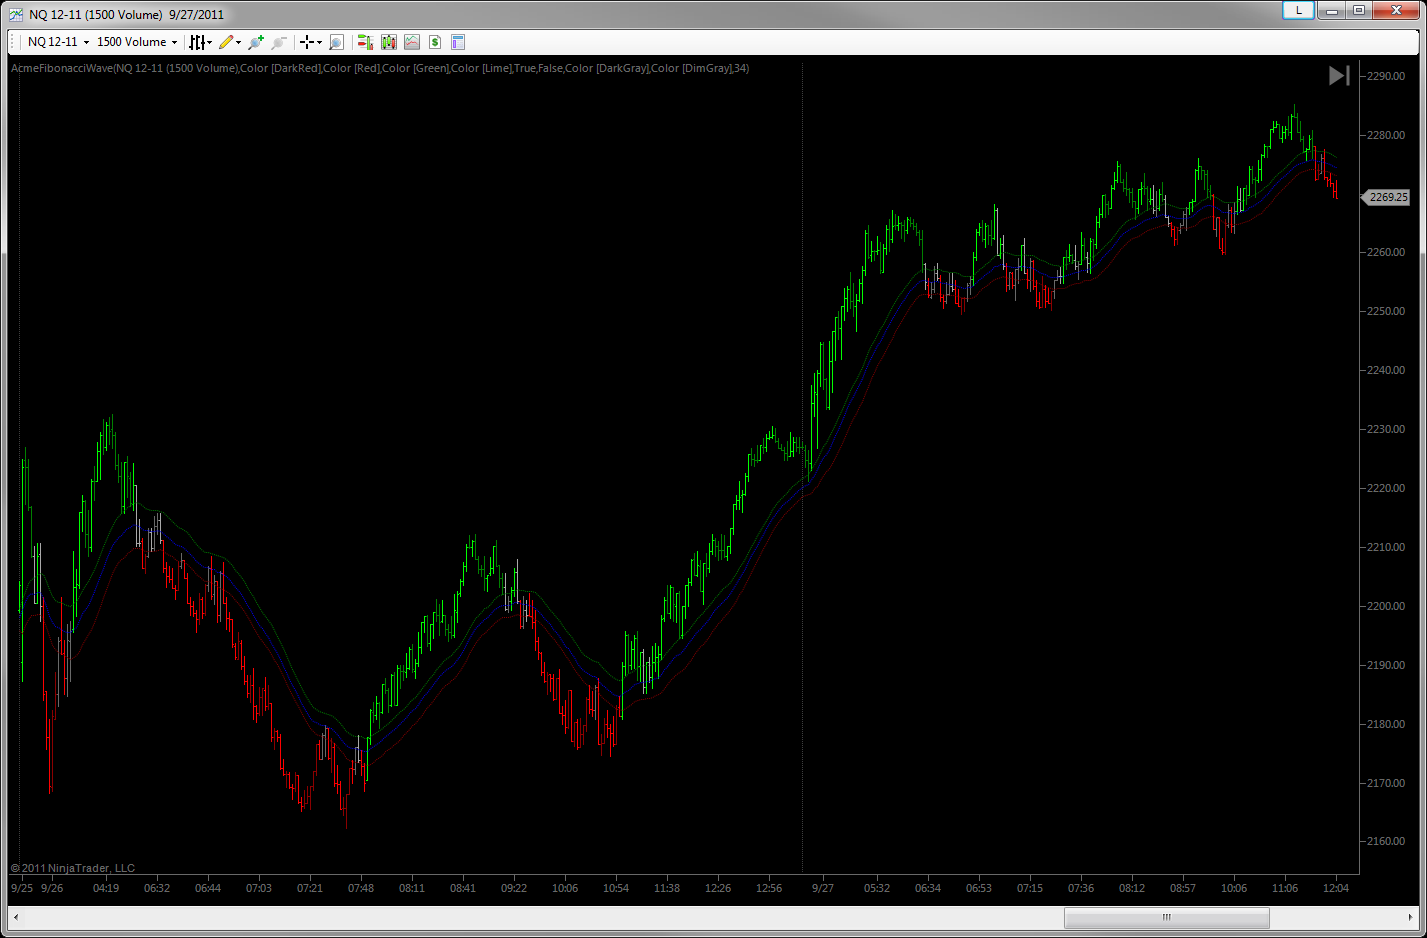
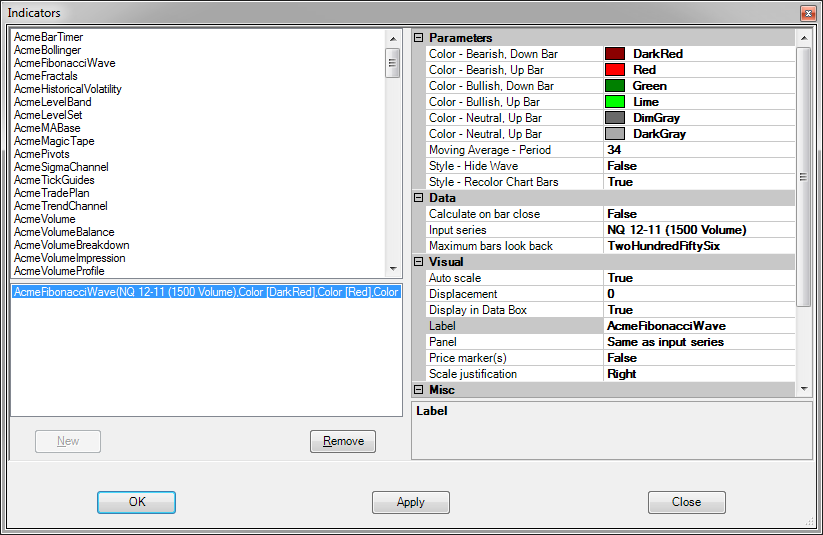
Fibonacci Wave
This is an idea we borrowed from noted forex trader Raghee Horner. It’s also known as the 34EMA Wave, and GRaB Candles. We won’t spend much time explaining it, because you should read all about in the inventor’s own words here. The Fibonacci Wave might very well be one of the best methods for visualizing a moving-average trend. We know many members and non-members alike who won’t trade spot forex without it. Even if you don’t trade forex, you can use it on any instrument on any time frame. Be creative. How could you fold it to your strategy?
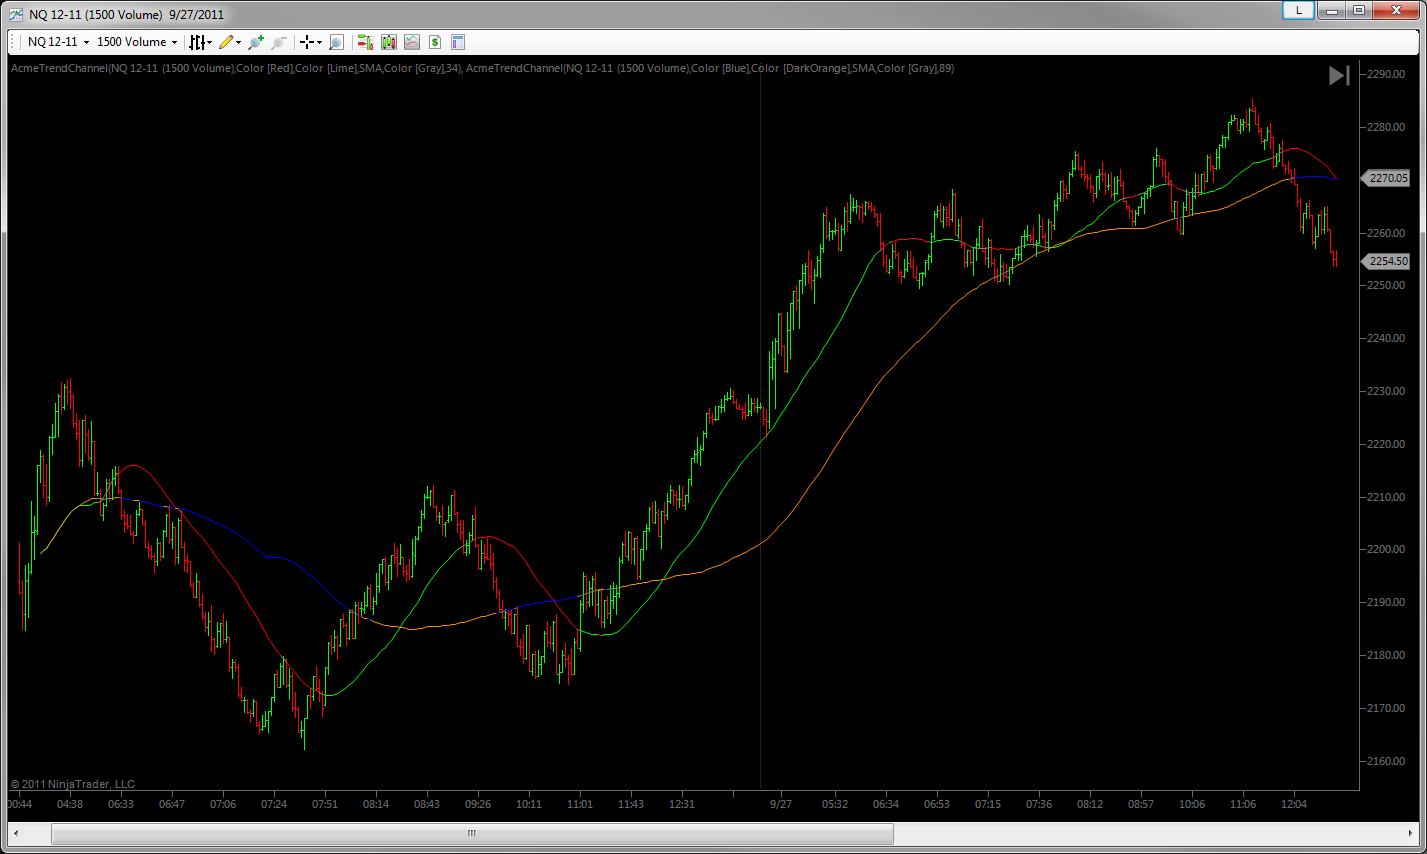
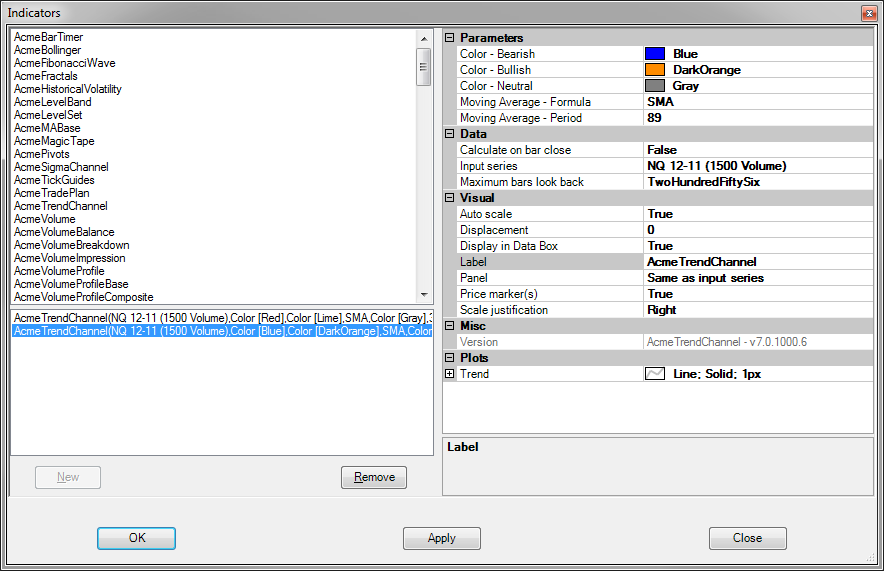
Trend Channel
This one is a basic moving average line, only with a couple of interesting, value-added twists. First, you have your choice of moving average formulas: simple; exponential; and weighted. So when you want to switch, just change the parameter instead of removing and adding a different indicator. The other, more interesting twist is that the line can be differently-colored when price is above (bullish), below (bearish) or on the trend line (neutral).