It’s all about context. In the markets. In trading. In life. Everything.
No matter your trading time frame, it’s a sure bet that you can better time your entries and exits by understanding what the markets as a whole are doing when you are considering pulling the proverbial trigger. The studies and indicators in this pack are designed to help you do exactly that, quickly and at-a-glance. Often, market internals contradict price action in the instrument you are trading. Other times, they confirm. Before placing a trade and literally every couple of minutes throughout the trading day, it can be important check the state of the broader market.
We liken it to driving a car. As you cruise down the road, every now and then you need to be looking in your mirrors. And you should always be aware of the cars and trucks that surround you, bicyclists next to you, pedestrians on the corner and the color of the stoplight ahead. What’s that? Yep. You guessed it – context.
Essentially, market internals are a trader’s rear- and side-view mirrors. Check them every so often, and certainly before you change lanes (make a trade), and often they can keep you out of expensive trouble (and avoid bodily harm?), or confirm that it’s all clear to make your move.
Market Pressure
And now for something completely different. Or is it? Either way, chances are you’ve not seen anything quite like this before.
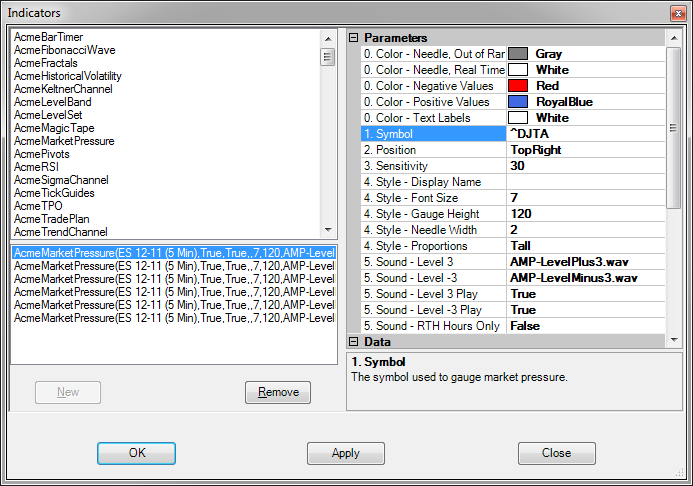
The Market Pressure (MP) is a true gauge-style display which measures movement of a symbol relative to a configurable period of time. It is specially designed to resemble a dashboard-style gauge in a car, which is something virually everyone knows how to read at a glance. Might seem a little gimmicky at first, but keep reading, give it a try and then make your call.
So what is it measuring? Volatility, pure and simple. Though you can use the MP with any symbol, it is specially designed to be used with market internals which, by definition, are transient, real-time market measures. For example, you can display any symbol as a bar chart… but what does it matter what level the NYSE TICK was at an hour ago? Or what about the US Dollar index? Can what happened yesterday in those symbols help you decide whether to take action in the markets right now? Nope. If you want to study correlations between internals and your favorite instruments… then bar charts are your friend. For real-time monitoring, they are really overkill.
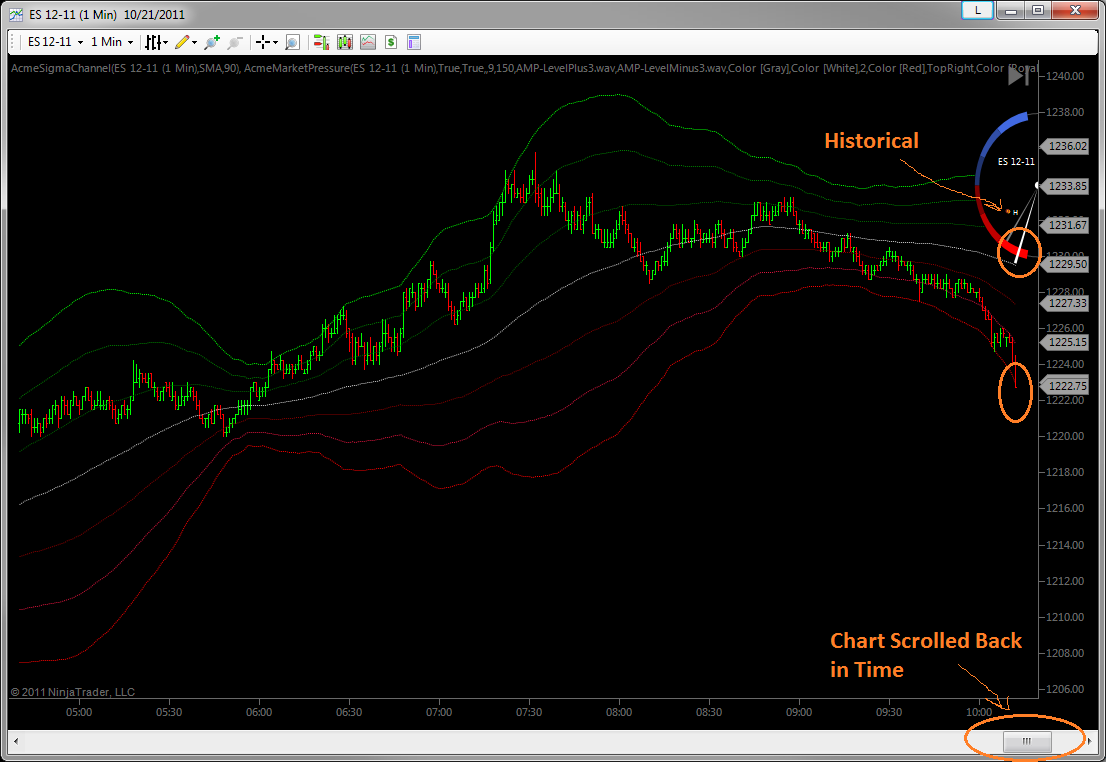
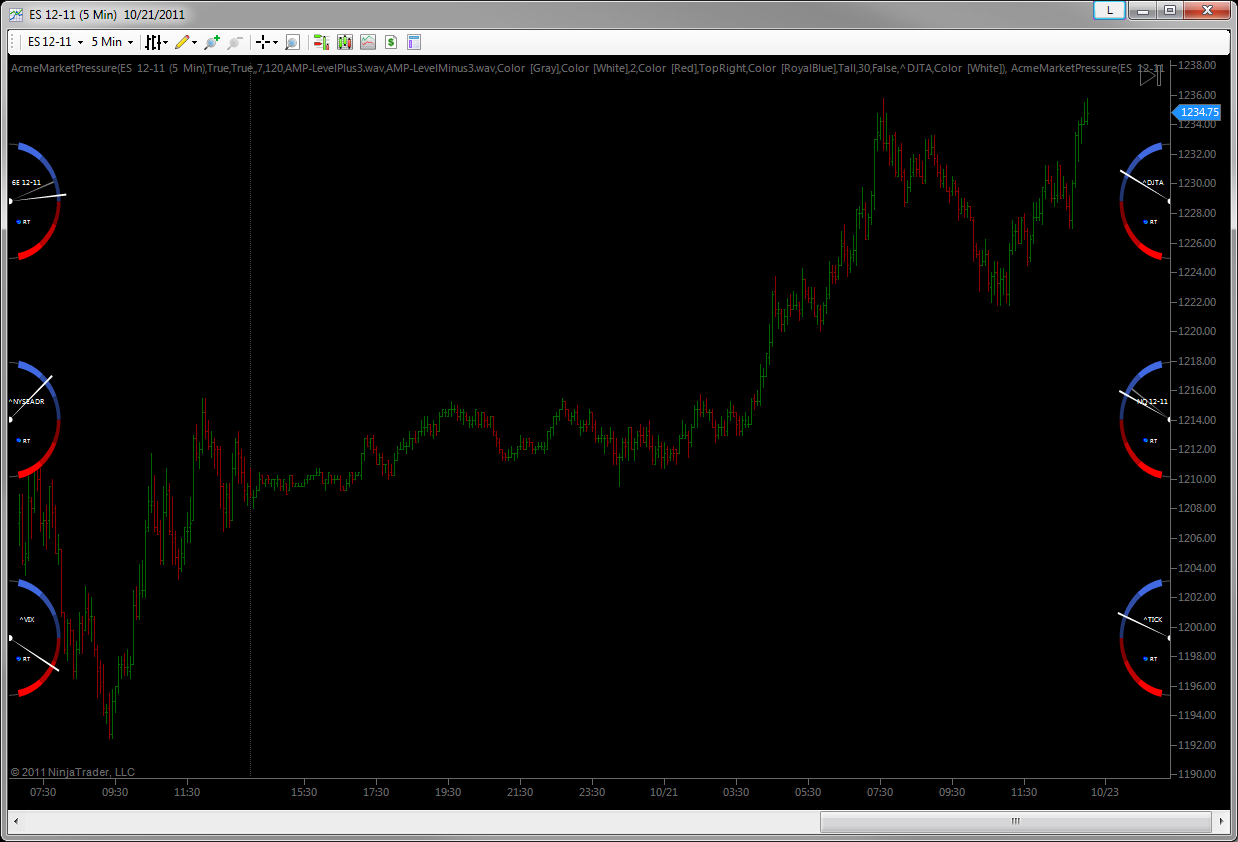
That’s where the MP gauges come in. They are real-time displays that are extremely space-efficient. How do they work? What exactly are they measuring? There’s no secret here – they are effectively another way to display the same information you’d see if you were using the Sigma Channel study on a bar chart. What’s more, the MP gauges display real-time and historical readings. A picture (or two) is worth 1000 words:

Internals to Watch
Below are some examples of what internals, indexes and other symbols we recommend watching, depending on market conditions.
NinjaTrader Symbol: ^TICKI use the NYSE TICK instead of the S&P500 TICK offered by some providers. It’s a very short-term measure of market activity and the TICK is highly correlated to moves in the ES. — IQFeed/Kinetick Symbol: JTNT.Z |
NinjaTrader Symbol:^VIXThe CBOE Volatility Index. It’s designed to show the market’s estimation of volatility in the next 30 days. It’s an effective measure even on much shorter timeframes, though. — IQFeed/Kinetick Symbol: VIX.XO |
NinjaTrader Symbol: (Custom)The Dow Jones Transportation Index is a weighted average of 20 transportation stocks. These are the companies that move goods around the country and the world, and they often lead moves in the senior indexes too, even intraday. — IQFeed/Kinetick Symbol: AI2T.Z |
NinjaTrader Symbol: NQ ##-##
|
NinjaTrader Symbol:6E ##-## or DX ##-##The Euro or the Dollar futures. In recent times, these two currencies tend to trade inversely to one another as well as the market. When the Dollar is weaker, US markets tend to rally. Vice-versa for the Euro. Pick either one… just depends on which way you like to see the needle on the gauge move, so to speak. — IQFeed/Kinetick Symbol: @EU or @DX |
NinjaTrader Symbol: (Custom)The NYSE Advance Decline Ratio is a pure market breadth index. It shows the number of stocks trading higher divided by those trading lower at any given moment. — IQFeed/Kinetick Symbol: IRNT.Z |
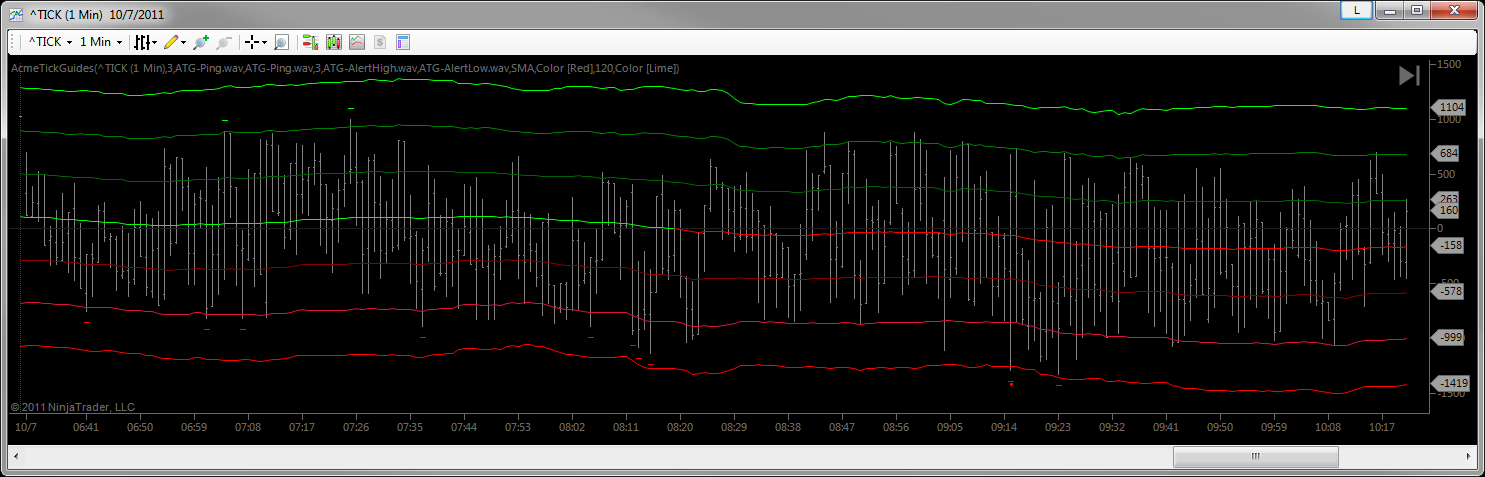
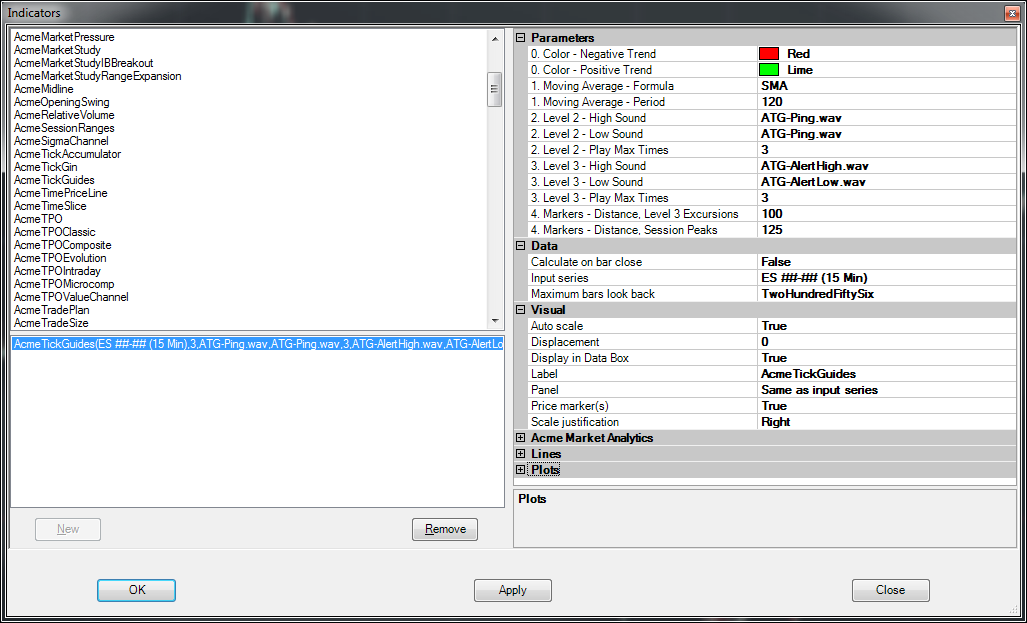
Tick Guides
This is a volatility-adaptive study designed especially for the market TICK indices. What are those? The are simply a real-time measure of how many stocks in that index are trading on an uptick or down tick (net) at any given moment in time. Each of the major indexes has one (NYSE, NASDAQ, etc.) and some data providers even have one especially for the stocks in the S&P 500.
In today’s market environment, much of the volume is transacted by large, automated trading algorithms. When one of these begins churning inventory, it’s very often enough to move a whole index or exchange up or down for a period of time. These programs, if they are accumulating positions are called buy programs. If they are in distribution mode, they are called sell programs. These institutionally-executed programs leave plainly-visible tracks on the price action of the day – if you know what to look for.
And as you’ve probably guessed already, the tick index for the exchange you are trading is one of the clearest ways to see when a buy or sell program is beginning, peaking or winding down.
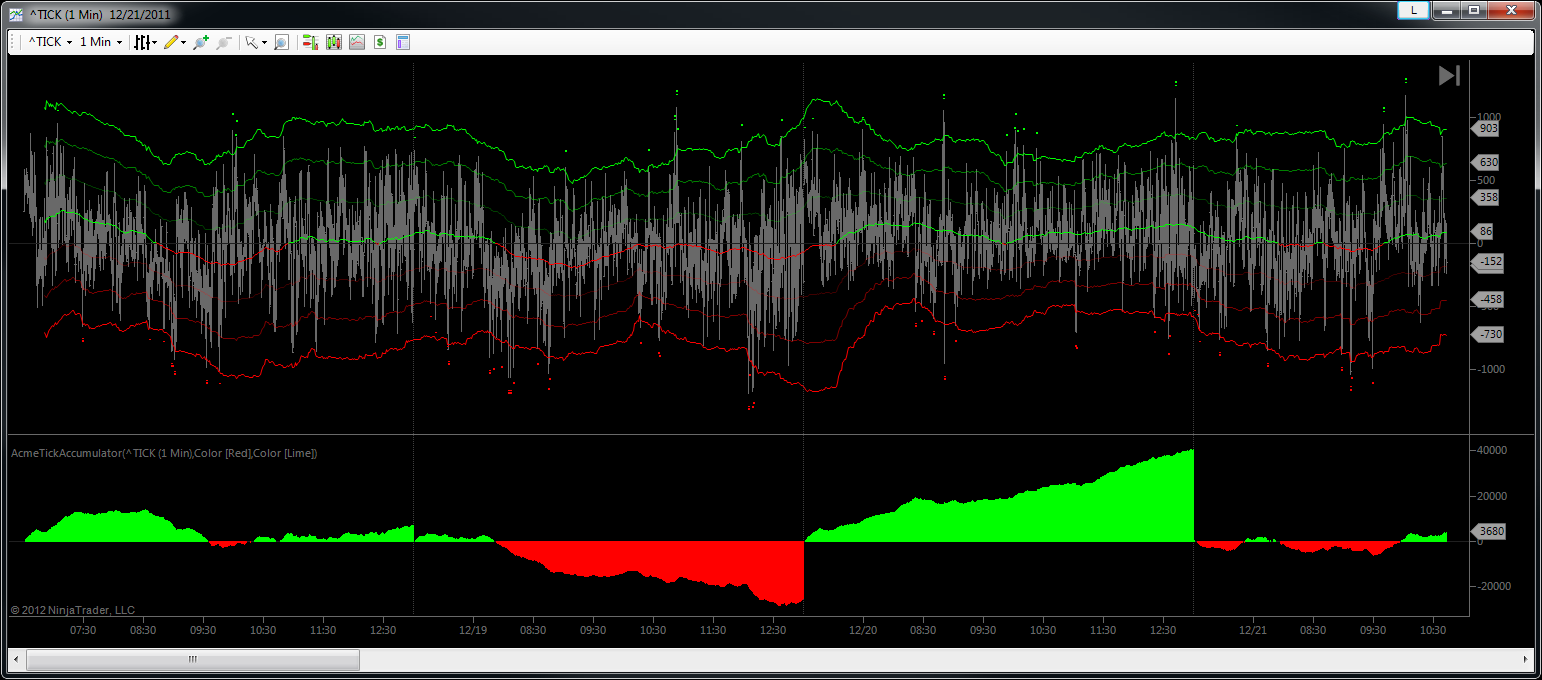
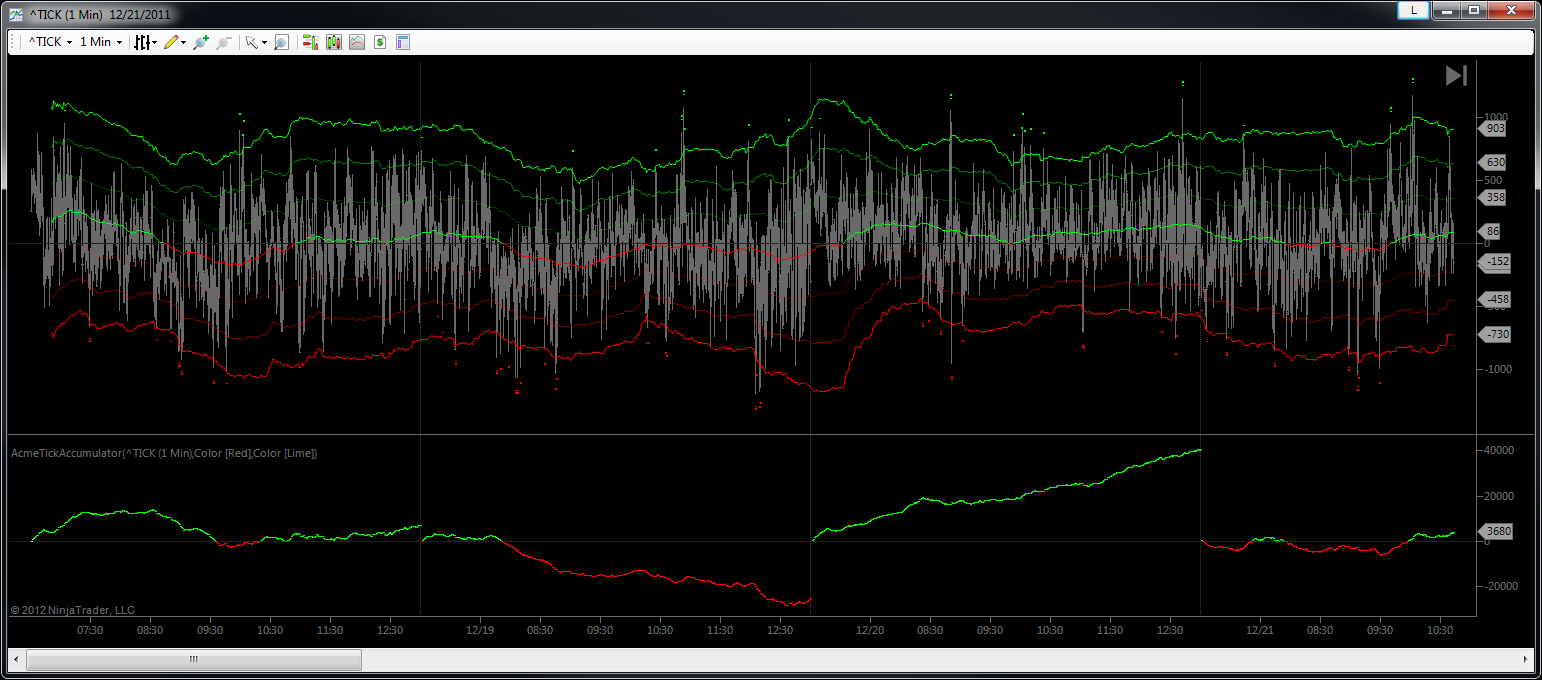
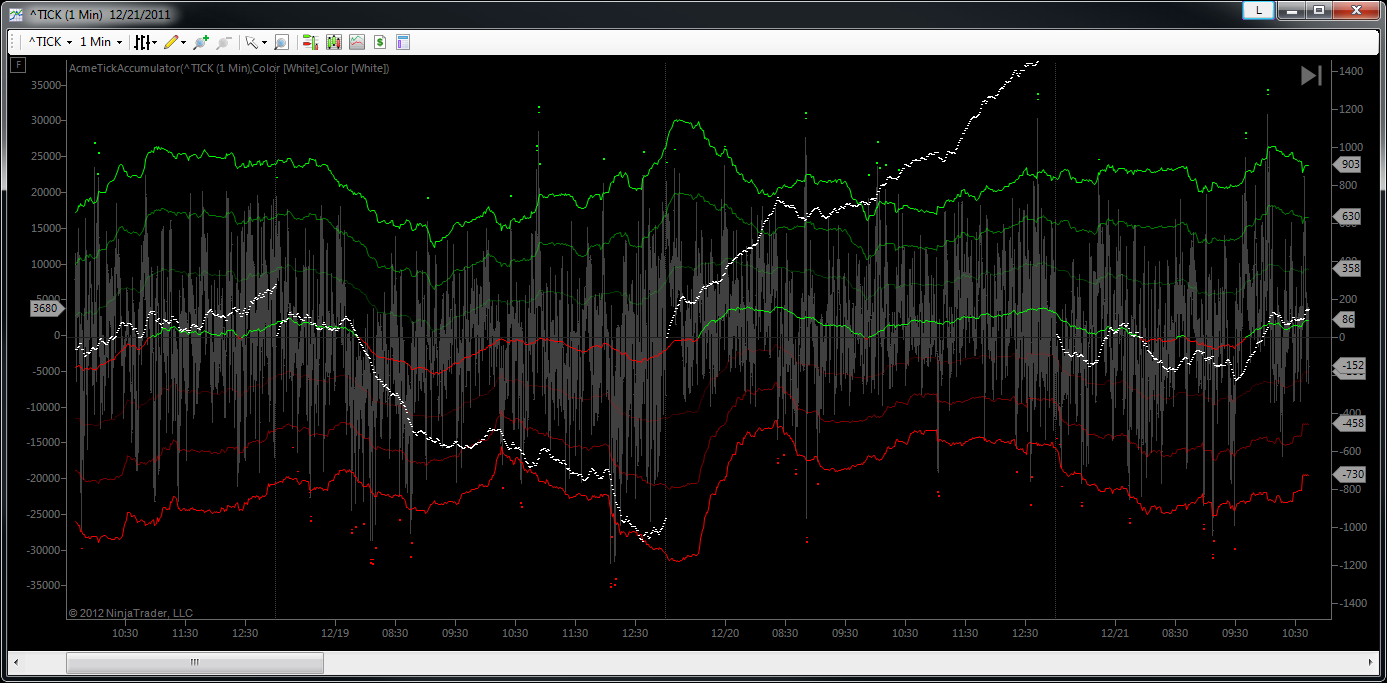
Acme Tick Accumulator
The tick accumulator is a companion to the Tick Guides above. Much like the volume cumulative delta study with which so many traders are familiar, when using this study on the ^TICK it will accumulate the values of the tick and help visually confirm broader market sentiment for the day. This method of looking at the TICK index was popularized several years ago by Dr Brett Steenbarger. For more detailed information on the rationale behind it, please see his blog post on the topic.
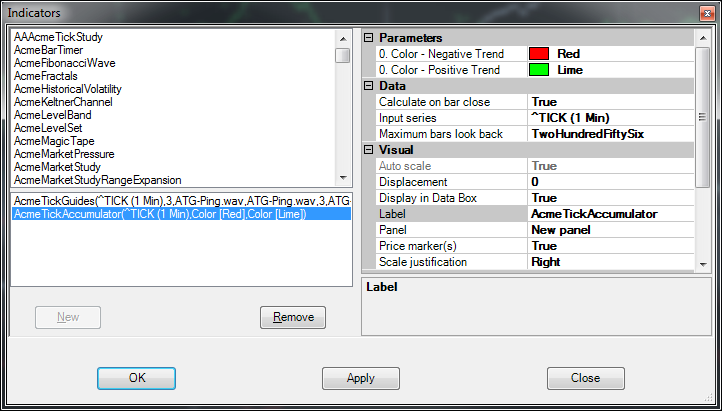
- Has configurable colors for positive (above zero) and negative (below zero) accumulations.
- Can use any of the built-in NinjaTrader plot types, such as bars, lines, dots and hashes, etc.
- Can be used either as a lower pane indicator, or as an overlay.