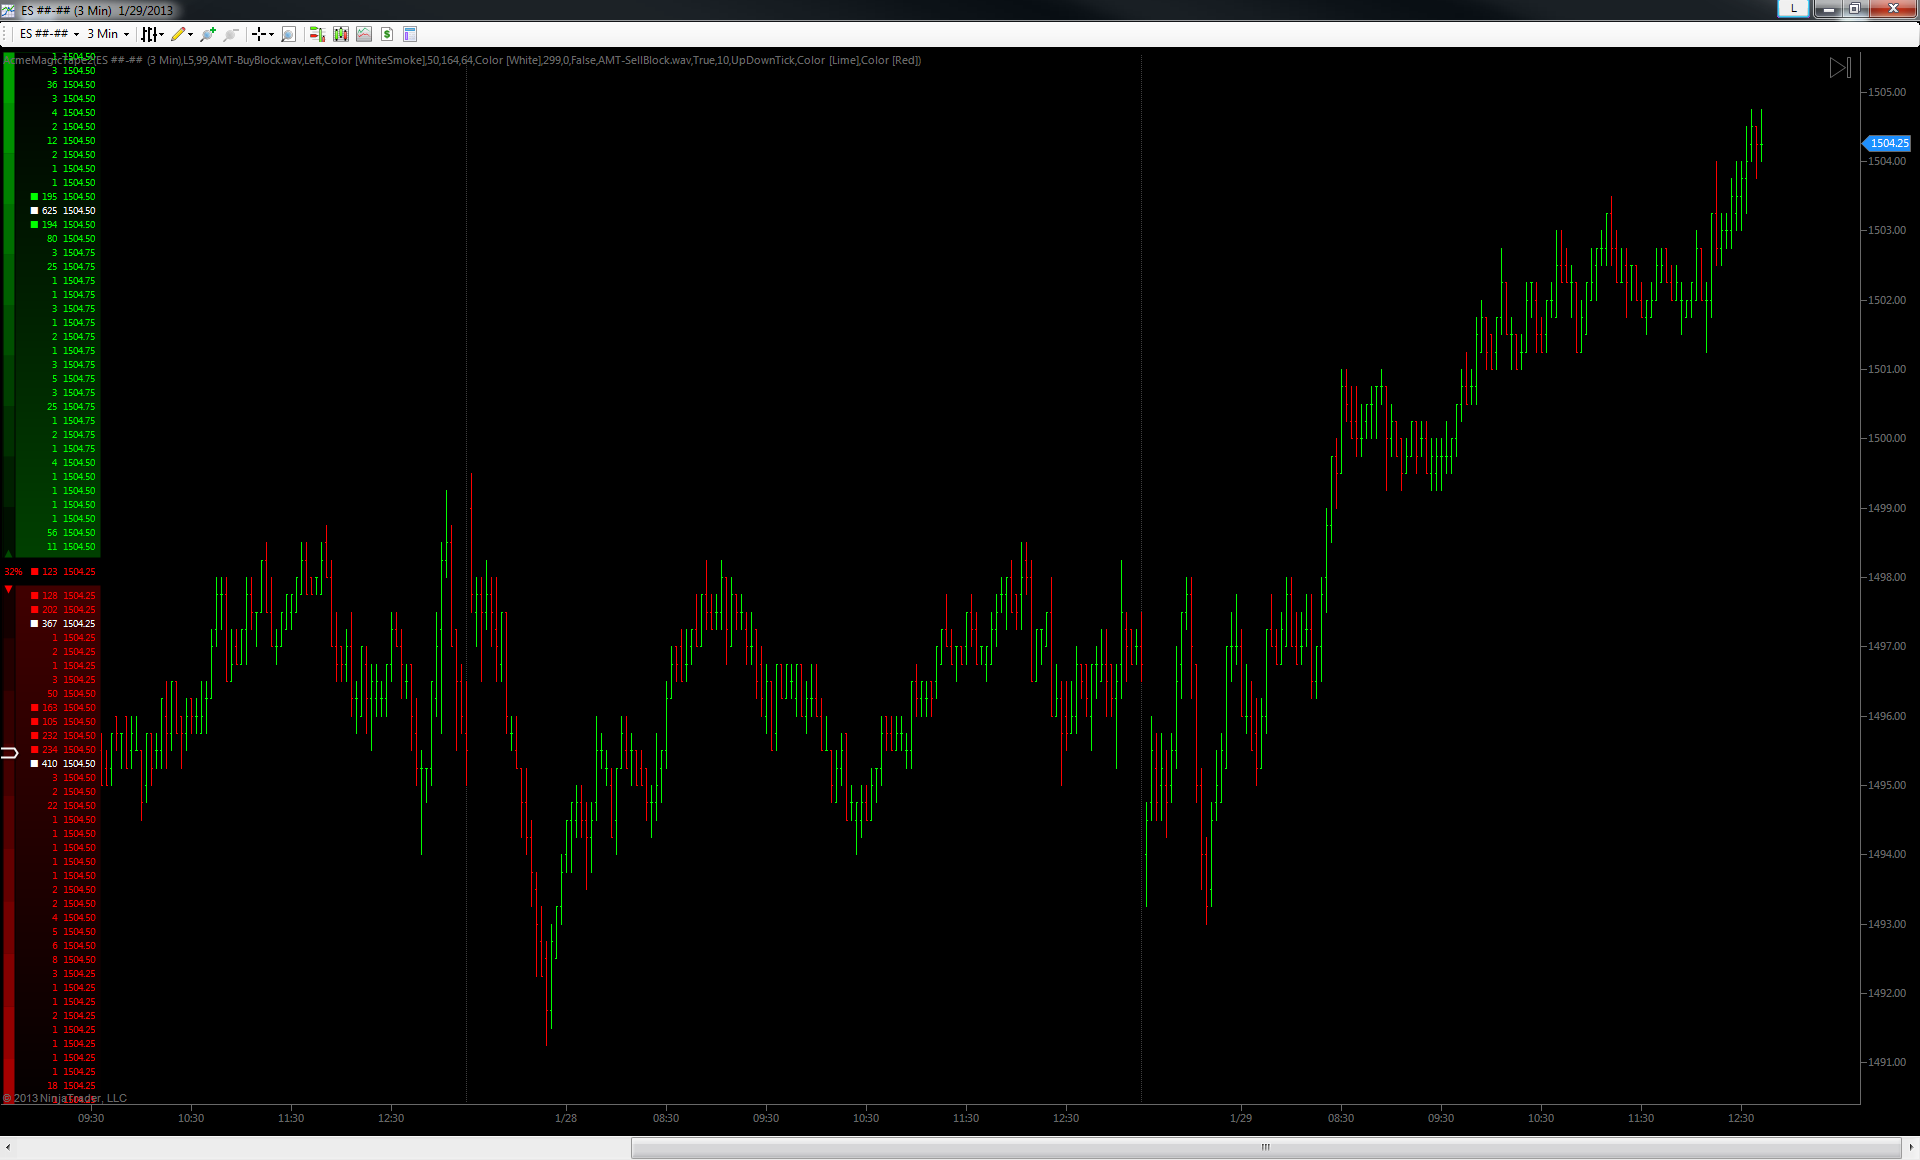
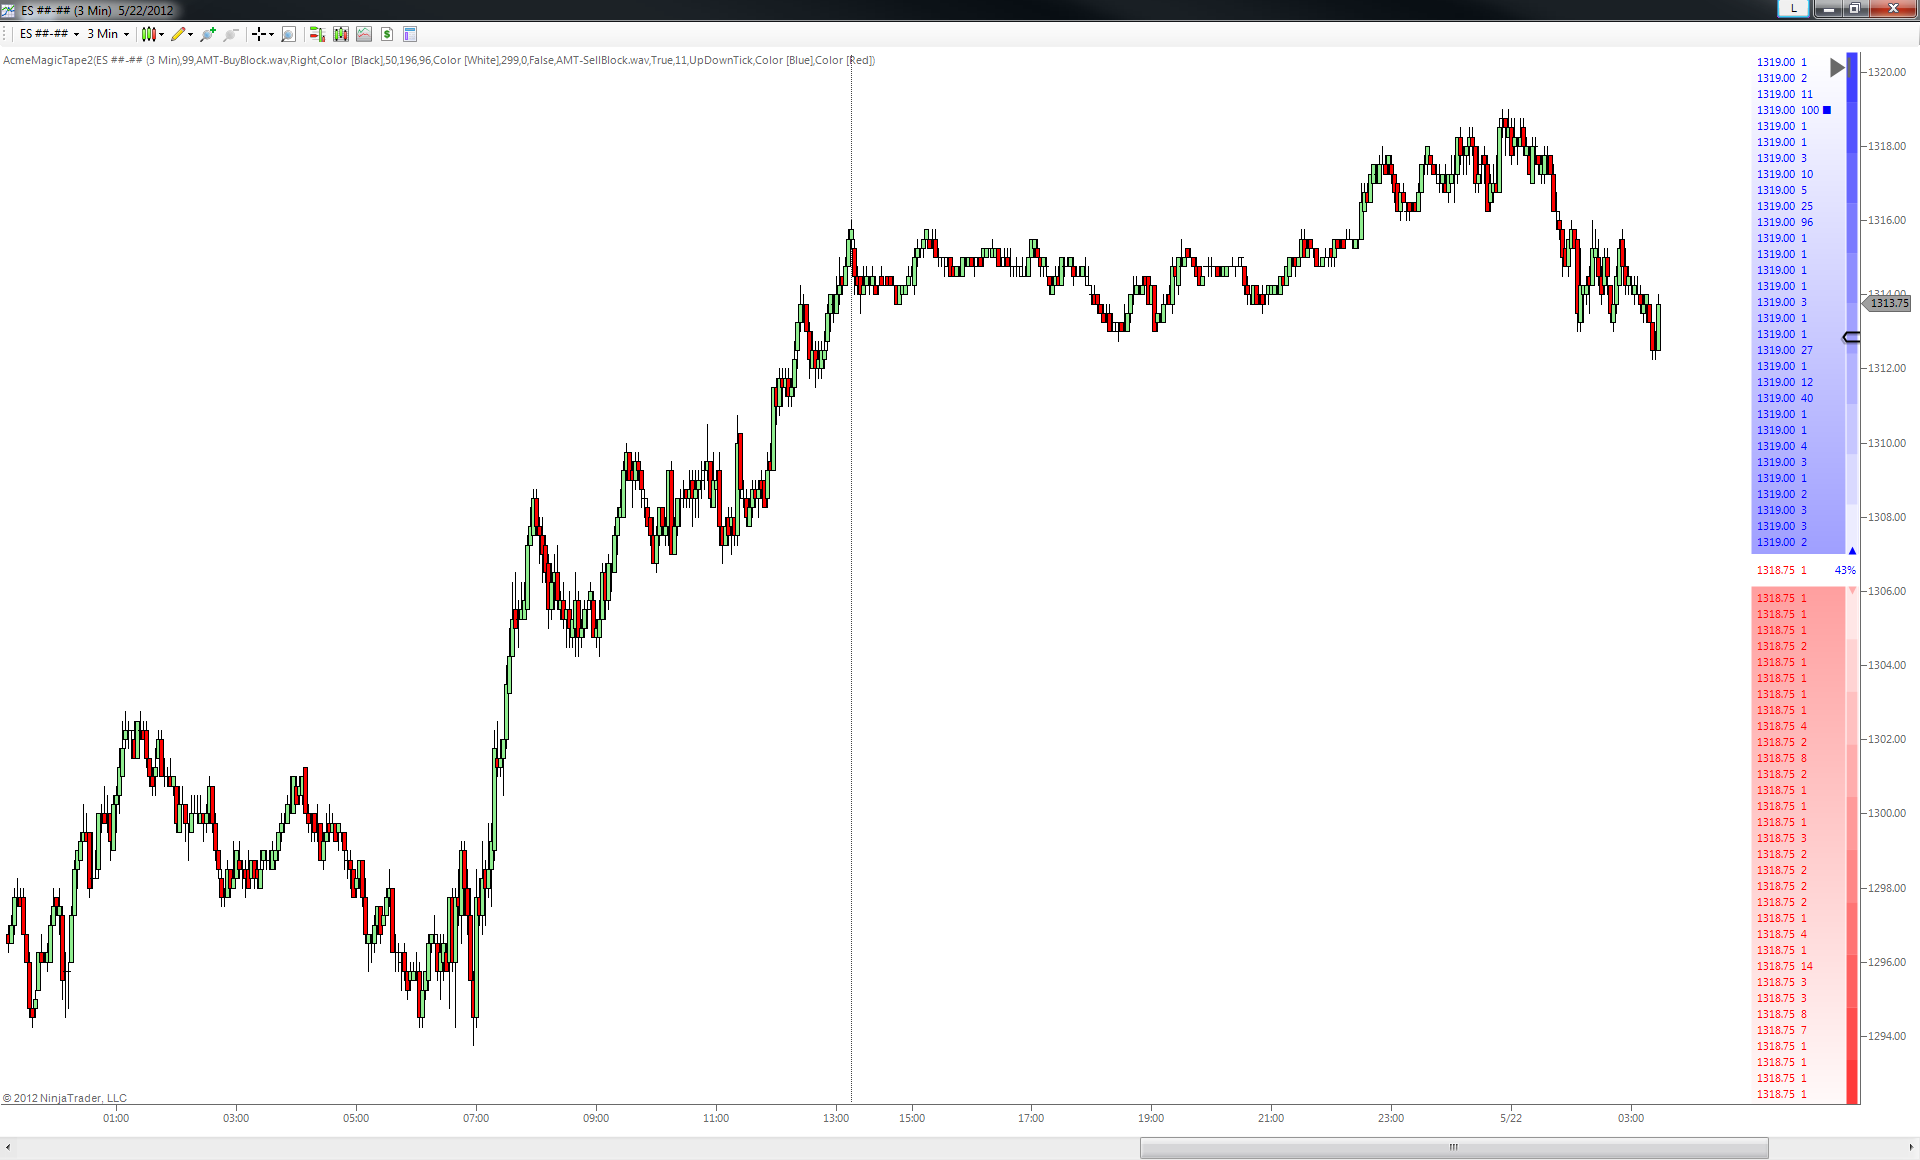
Magic Tape2
This one is really the more sophisticated sibling of the Magic Tape. It fills much the same role, albeit in a fresher, newer, non-linear way. What’s it do? Well, like the original Magic Tape, this one shows the proverbial “tape” (see below). Though instead of just showing each transaction as a buy or sell in a vertical sequence of times and numbers, this MagicTape2 splits each transaction into buys and sells, then sends the buys skyward and the sells Earthward. In addition to this, it calculates and displays an instant, rolling volume delta, as an easy-to-understand percentage, based on a configurable number of previous transactions. This may be a very interesting alternative to reading the DOM for many folks who can’t or choose not to.

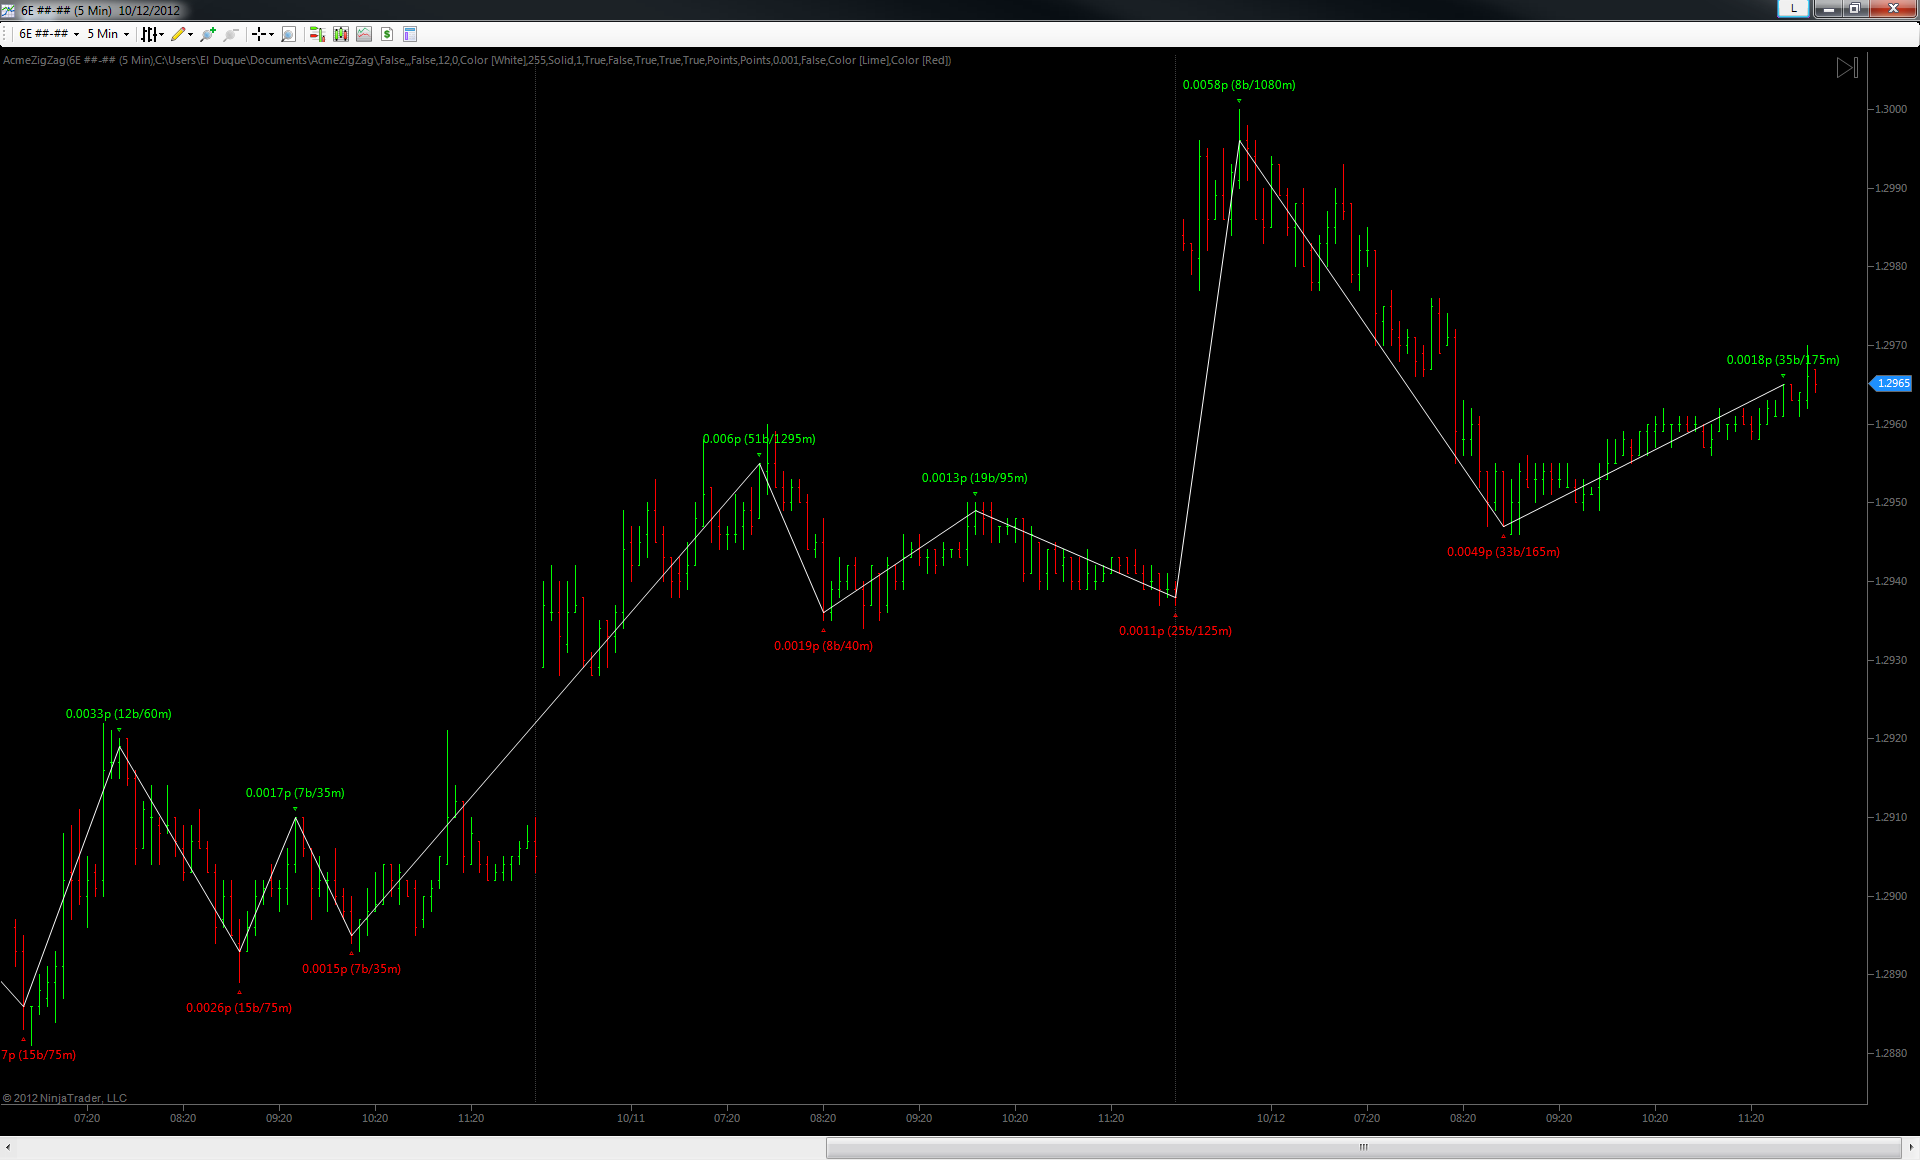
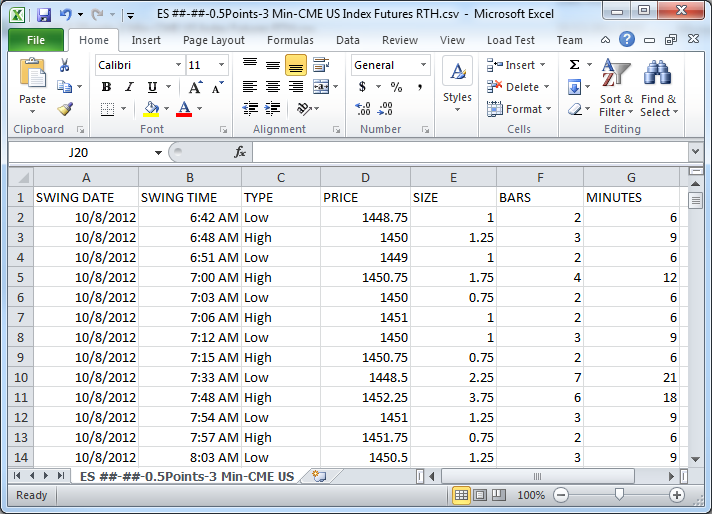
Zig Zag
No matter what you trade it can pay to know how your instrument tends to swing and rotate. In fact, it could be argued that you need to know this information in order to help develop a picture of what’s likely to come next. For example, here’s a story problem not unlike ones you probably had in grammar school:
If you know your instrument tends to swing 10 ticks on average and 20 ticks at the 2nd standard deviation extreme, and you’ve already seen a 20 tick move, what’s the probability of further move in the same direction? Ding ding! That’s right, about 5% or less.
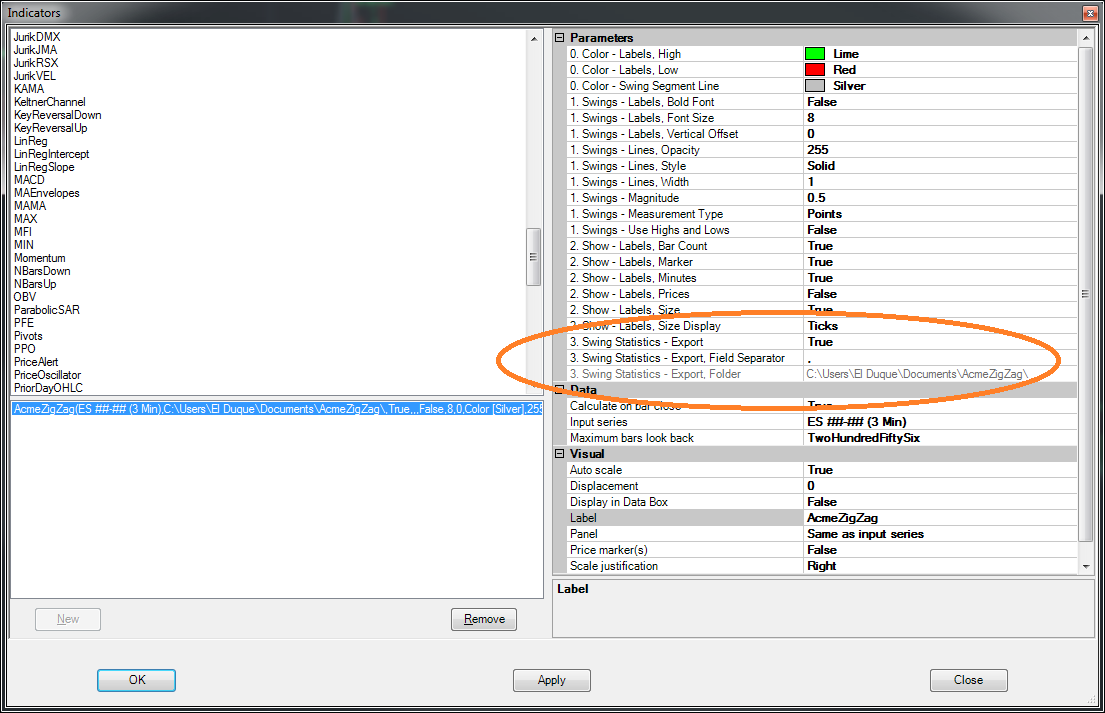
Our Zig Zag study not only helps you visualize the swings on the chart but, as seen in the example above, can export them for deeper study as well.


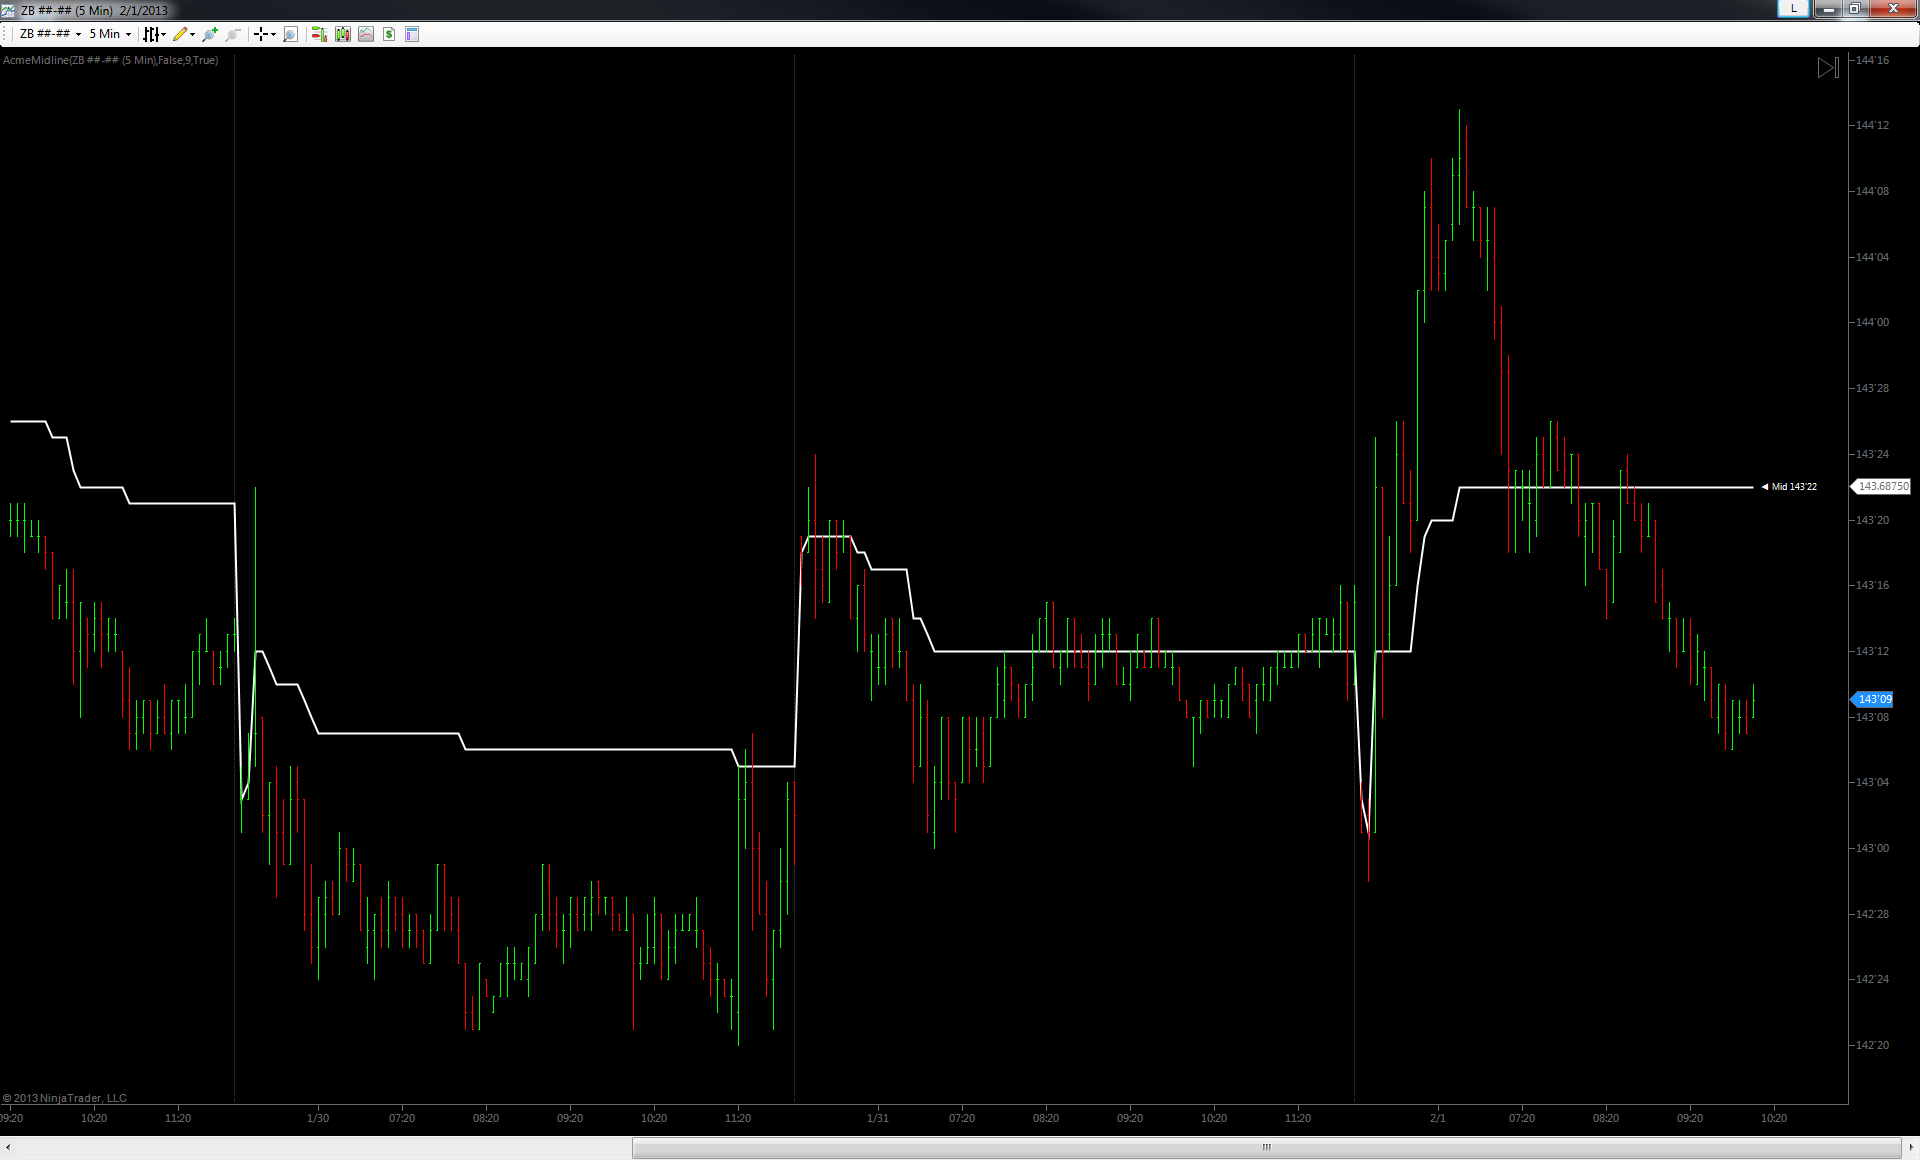
Midline
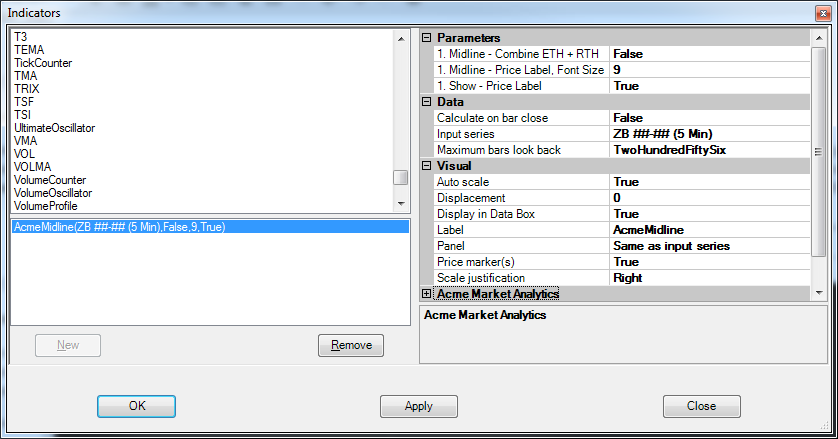
When someone comments that you’re a ‘minimalist’ how do you react? Well, no one likes to be labelled, but if somewhere deep down in your gut you know it’s at least partially true then this one should appeal to you. Really, its beauty and usefulness are in its simplicity. It has blissfully few parameters – its one and only function is to track the session range midpoint. Perhaps best of all it supports split sessions ala most of the other session-focused studies.
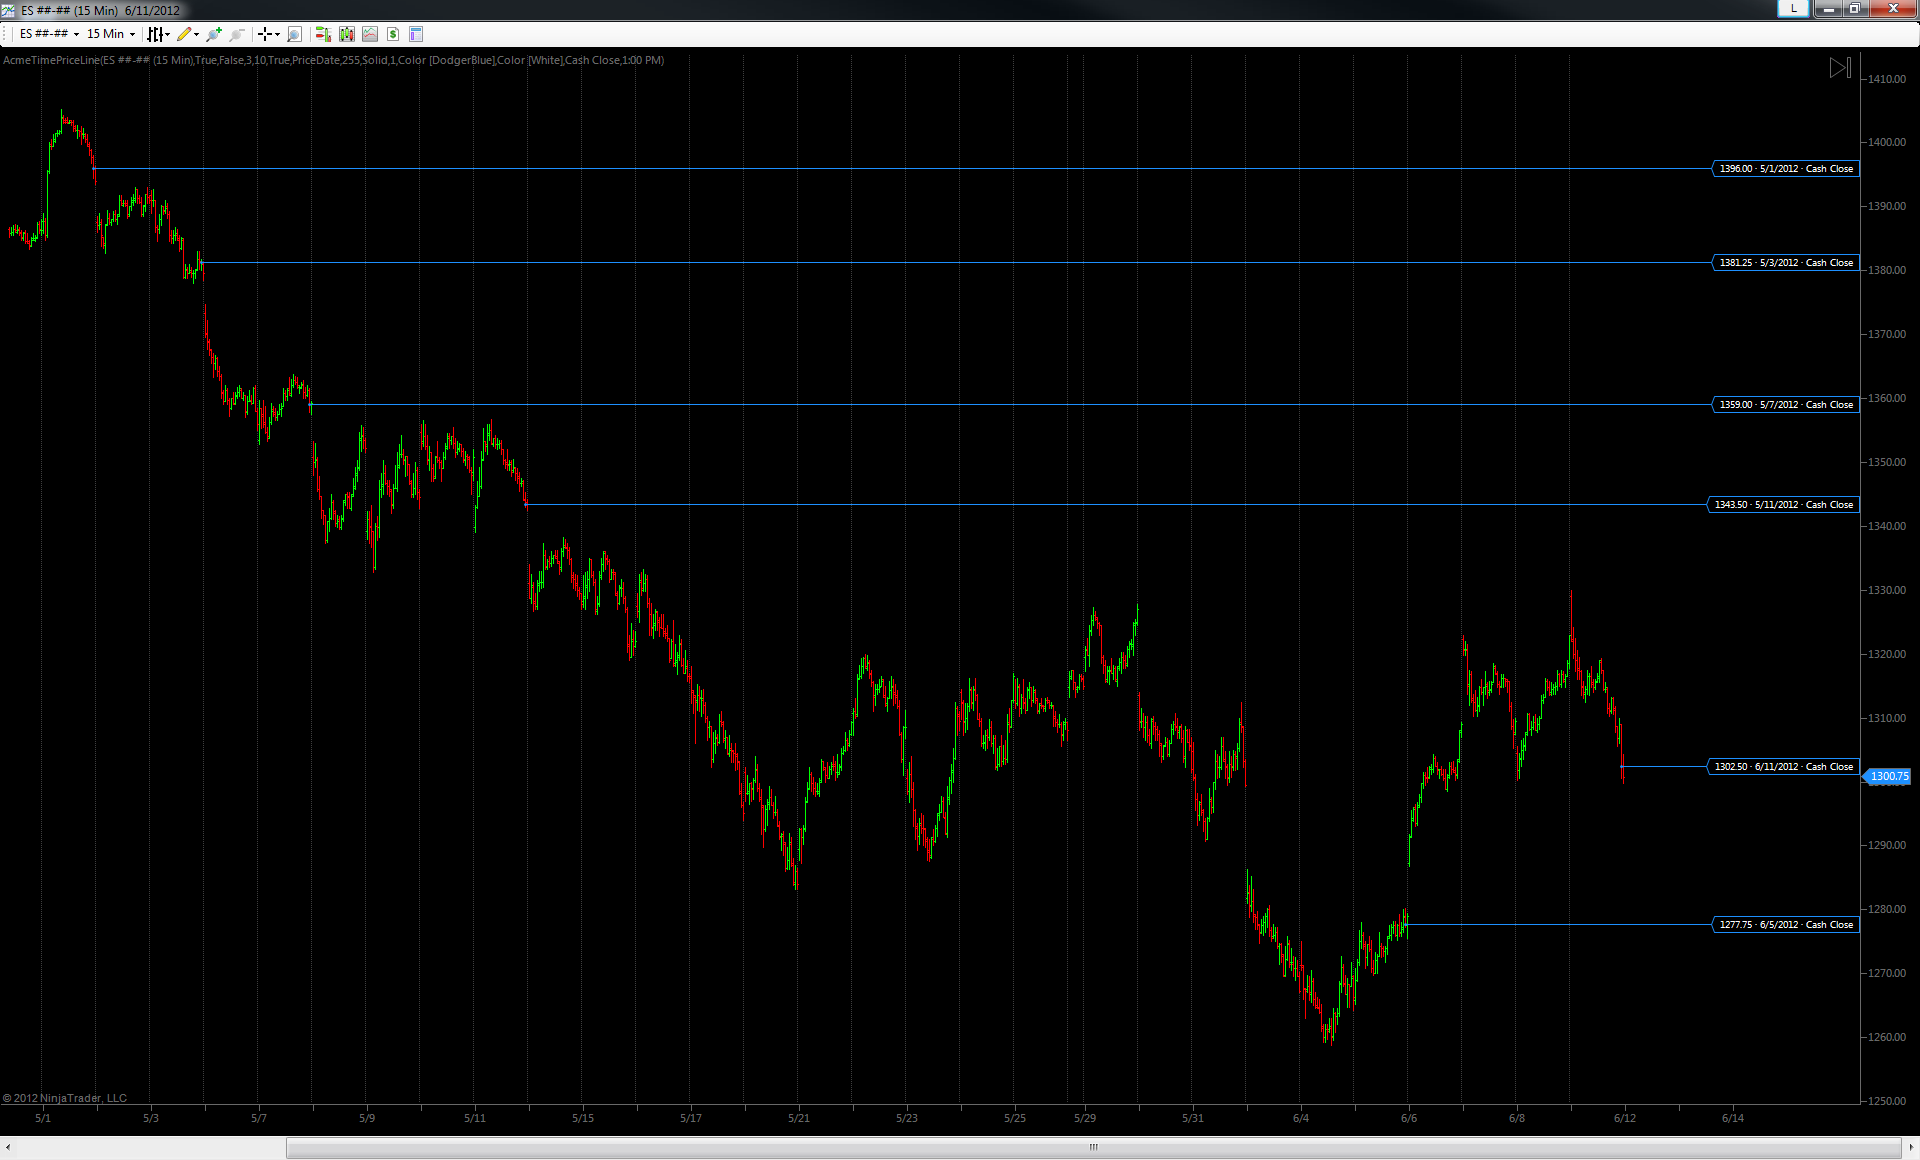
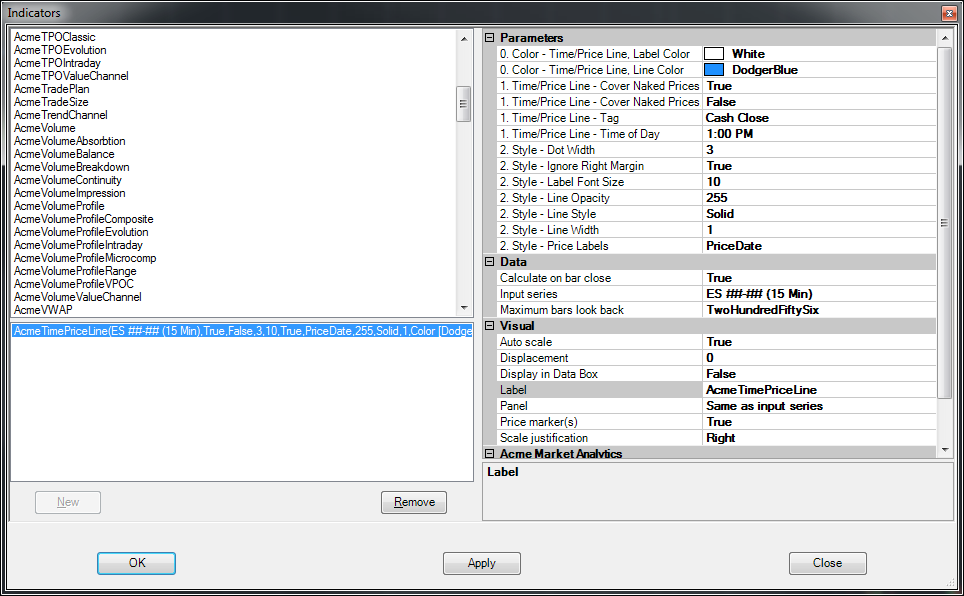
Time/Price Line
Are you an index futures trader? Do you wish there was a simple way to track the equities cash close versus the instrument close? Trade currencies or precious metals and want to track prices at the times then other markets close? And do you wish that there was a way to have the price appear on the chart as a “naked” line that would disappear when it was tagged again at a later date? Well, wish no more. It’s here and it’s got some very interesting features too.
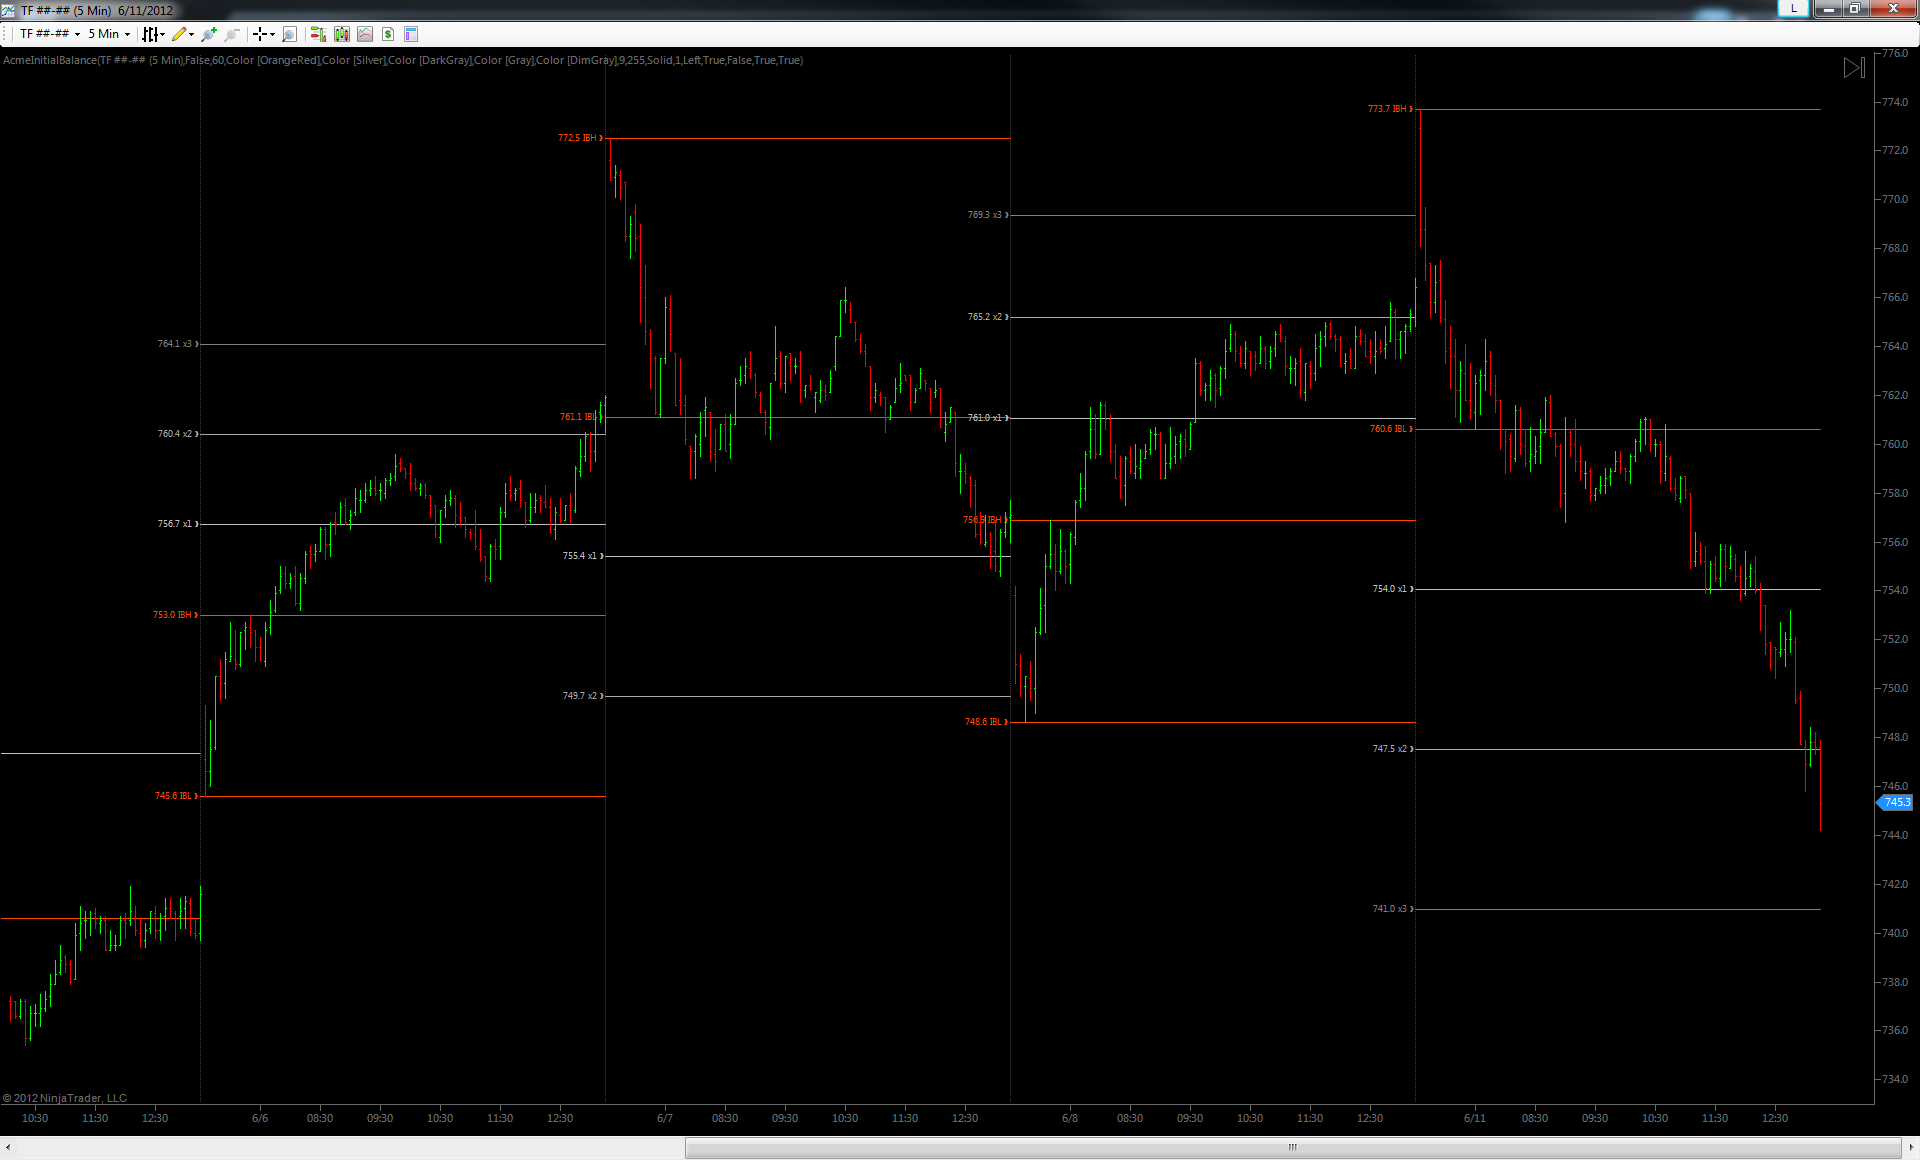
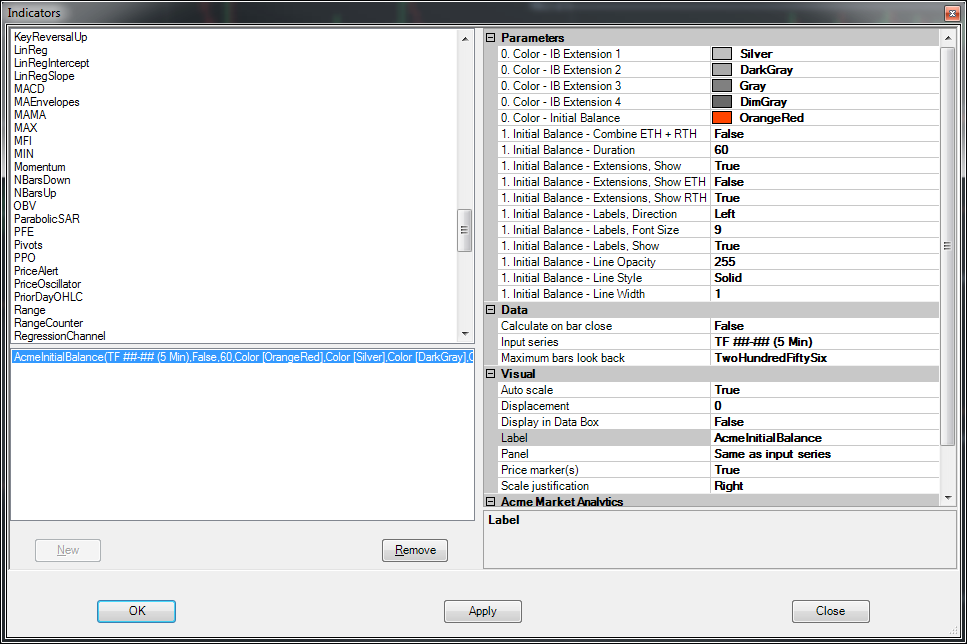
Initial Balance
Minimalists unite! The Initial Balance (IB) shows displays the initial balance range and nothing but. Except, of course, up to 4x upper and lower 50% IB extensions, which covers more than 99% of trading days in all futures instruments. To minimize clutter on the chart, each extension automatically appears after the IB range is known and as price tags each successive level on either the high or low side.
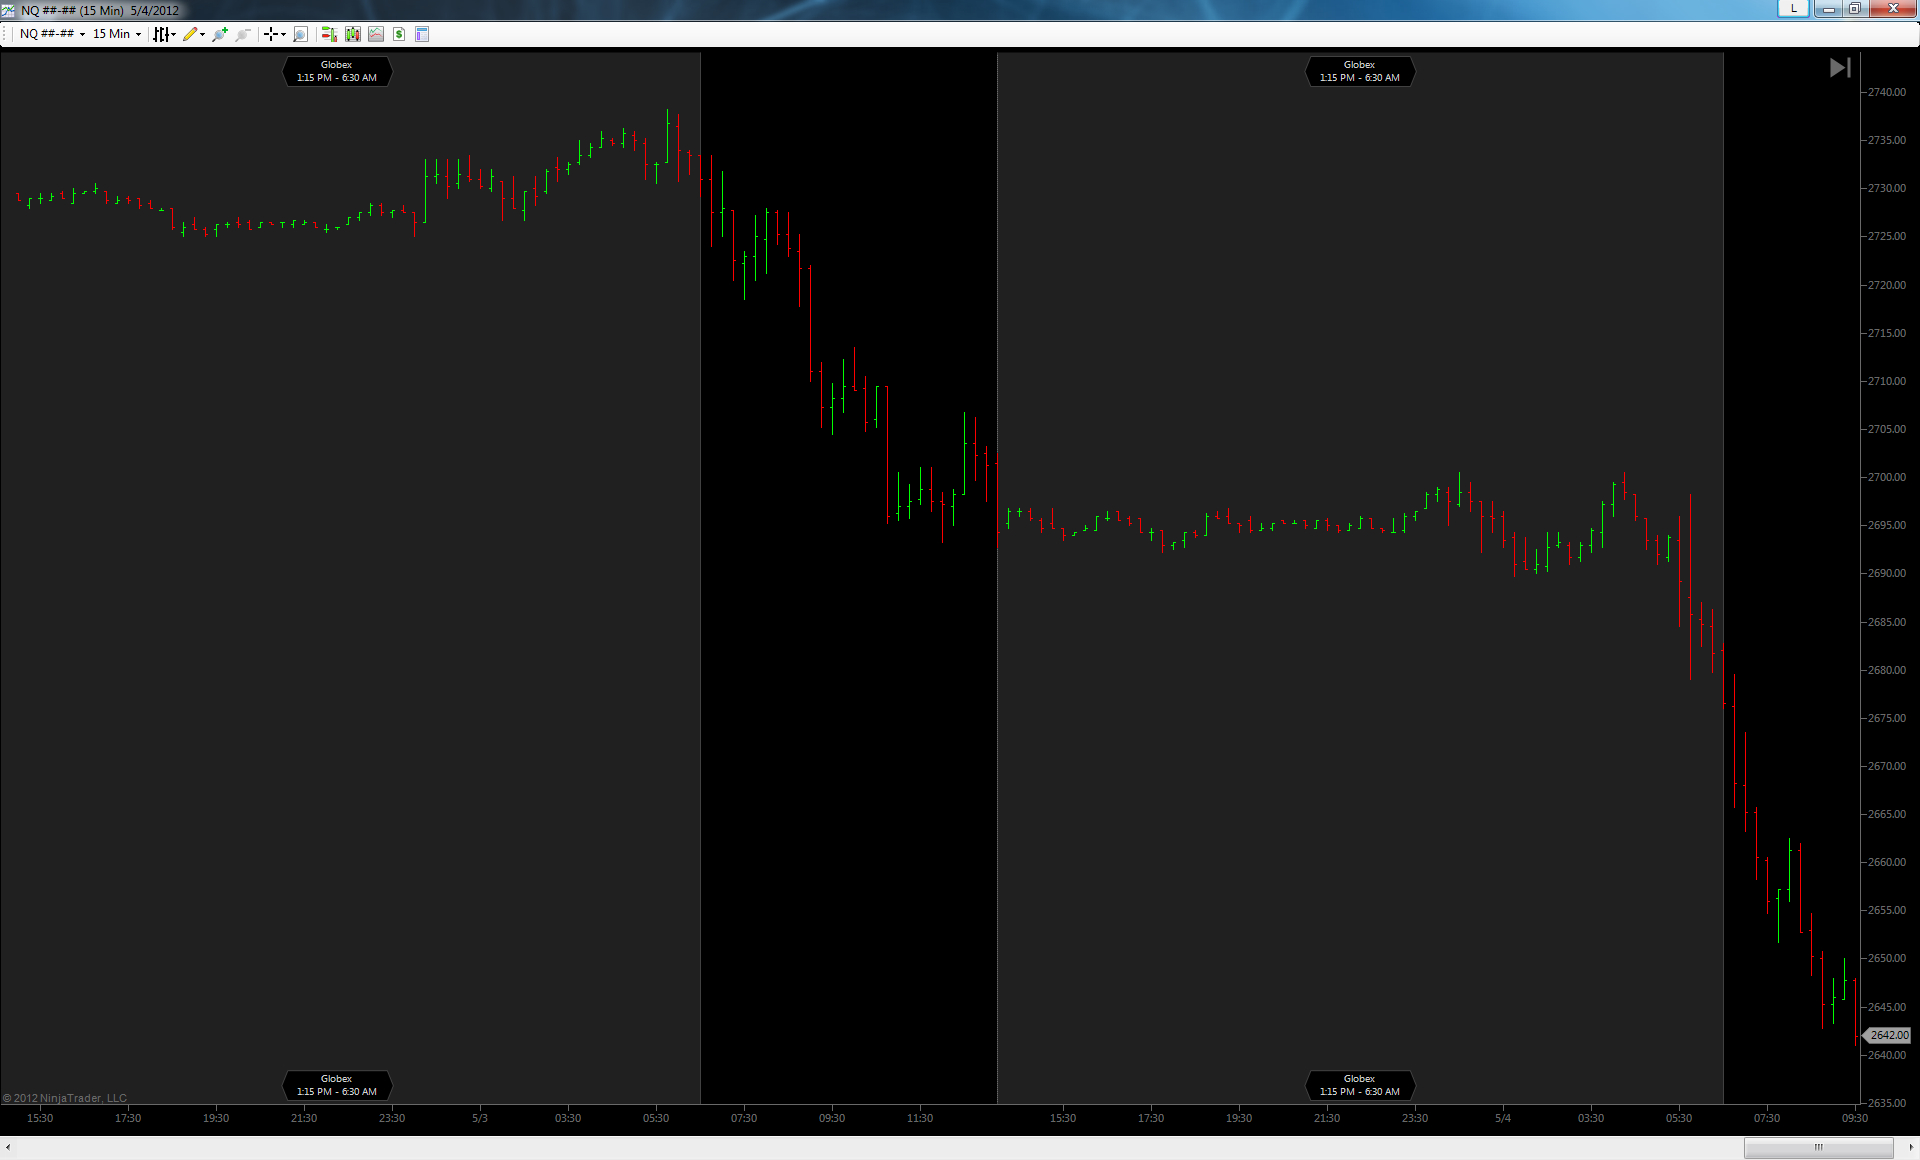
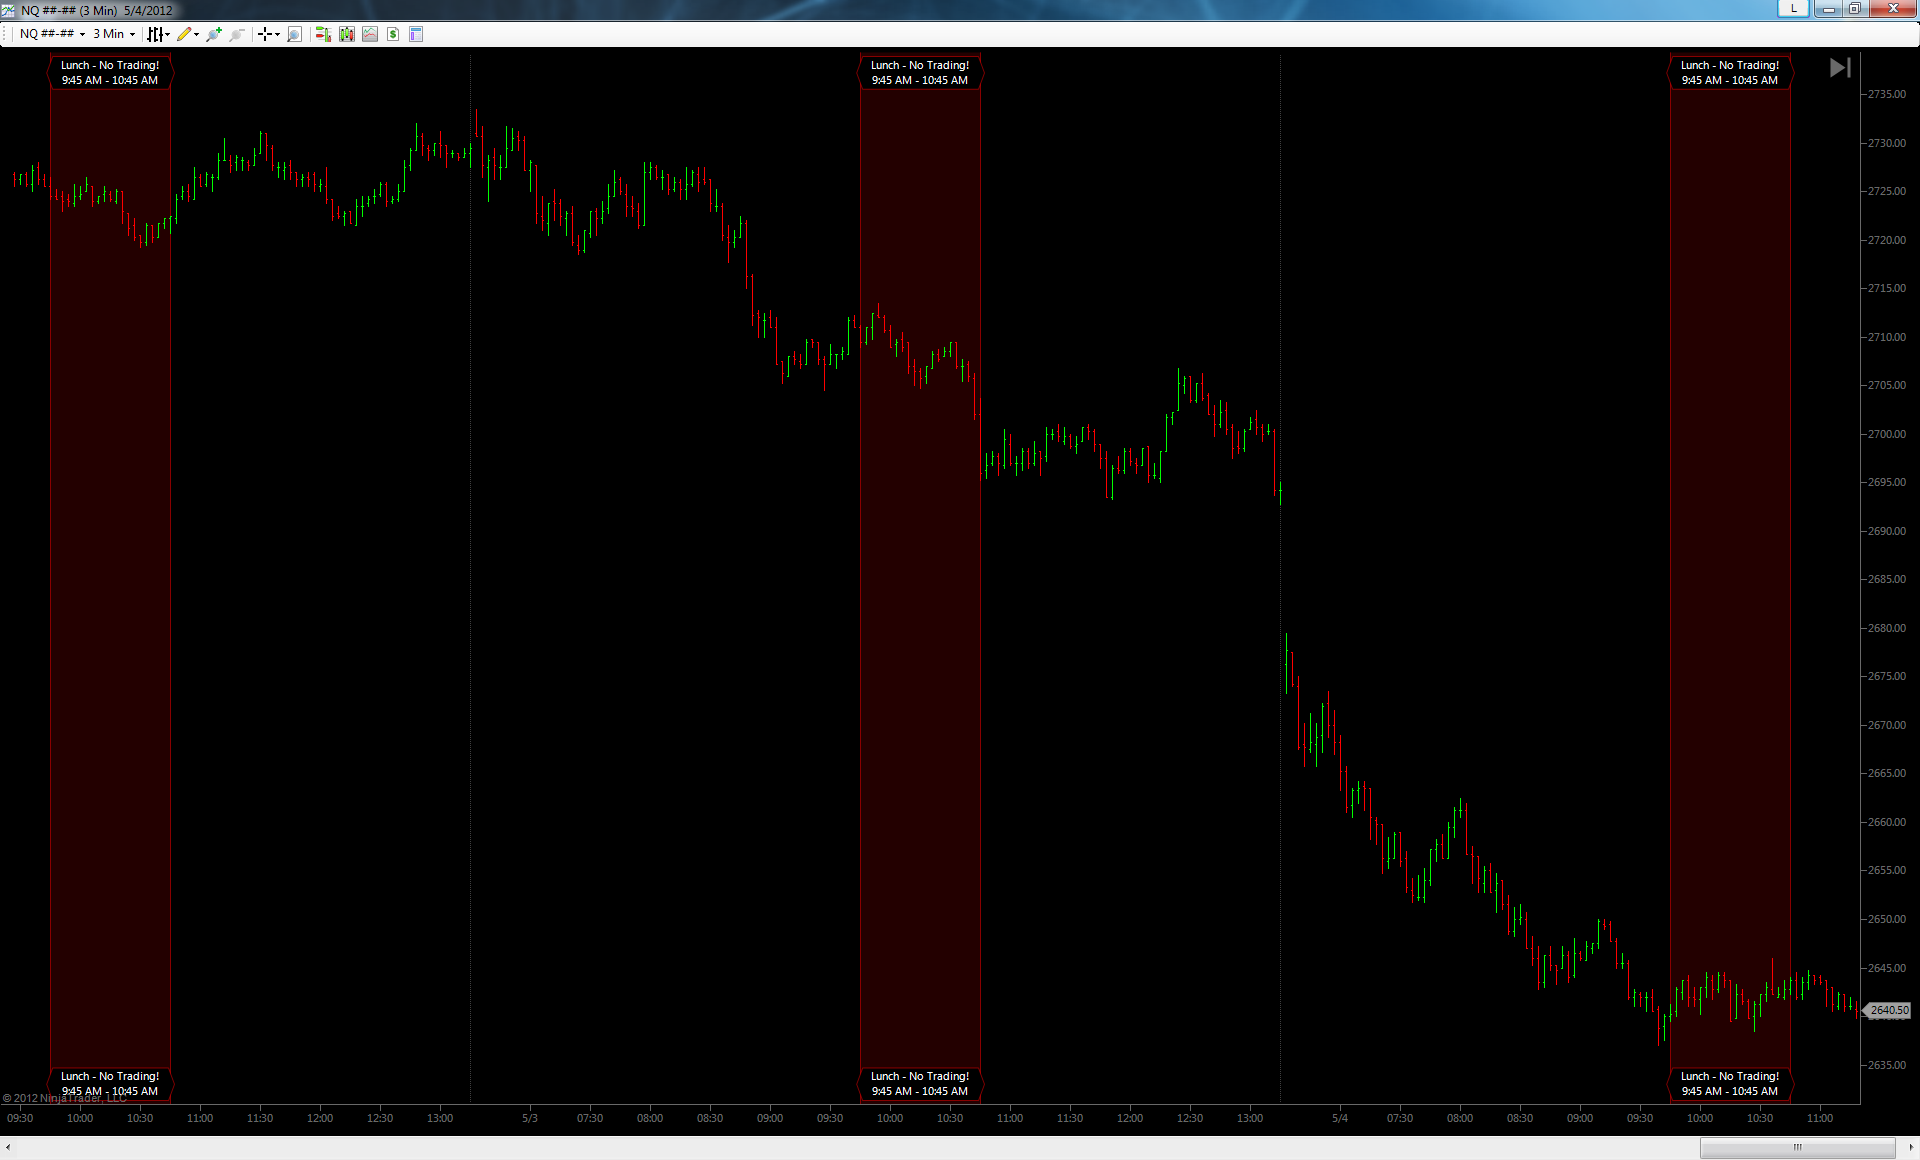
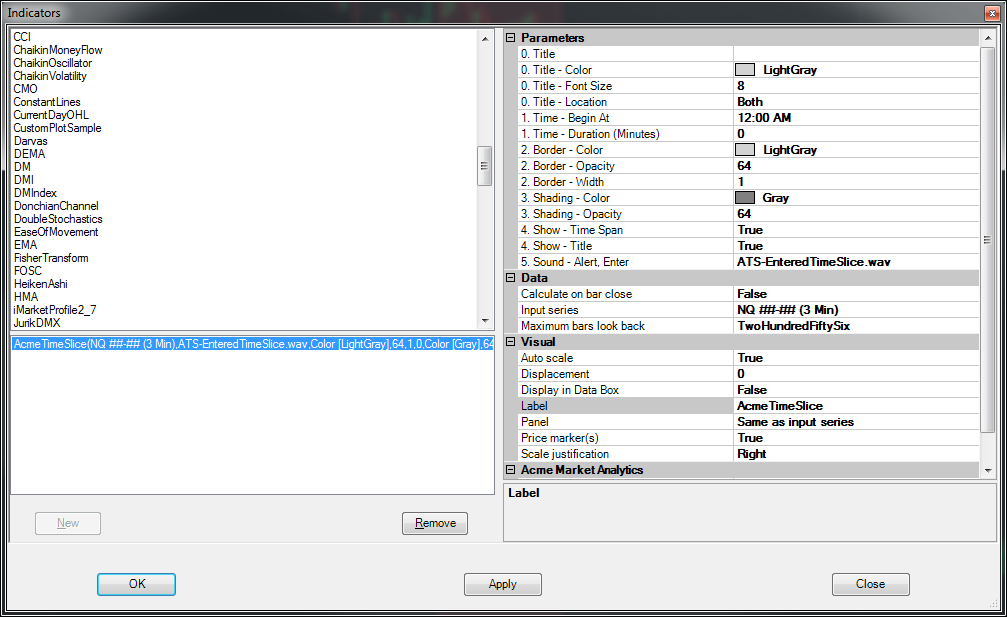
Time Slice
Even wanted to highlight a time in the trading day when you should pay attention? Know of some special times of day where volatility is statistically high? Well want no more. The Time Slice allows you to define, highlight and label a regularly occurring span of time each day. For example, you can use it to highlight the Globex session, the lunch hour, the London or Asian sessions or just about anything of that ilk. You can have as many slices on a chart as you like, they can be in sequence and they can even overlap. It also has a configurable audio alert that can be triggered when a bar enters the slice or zone. In some ways, you can think of it like the Trade Plan, only with vertical bands instead of horizontal ones. A simple thing really, but it can really help visually organize your chart and help you pay attention to the price action instead of the clock.
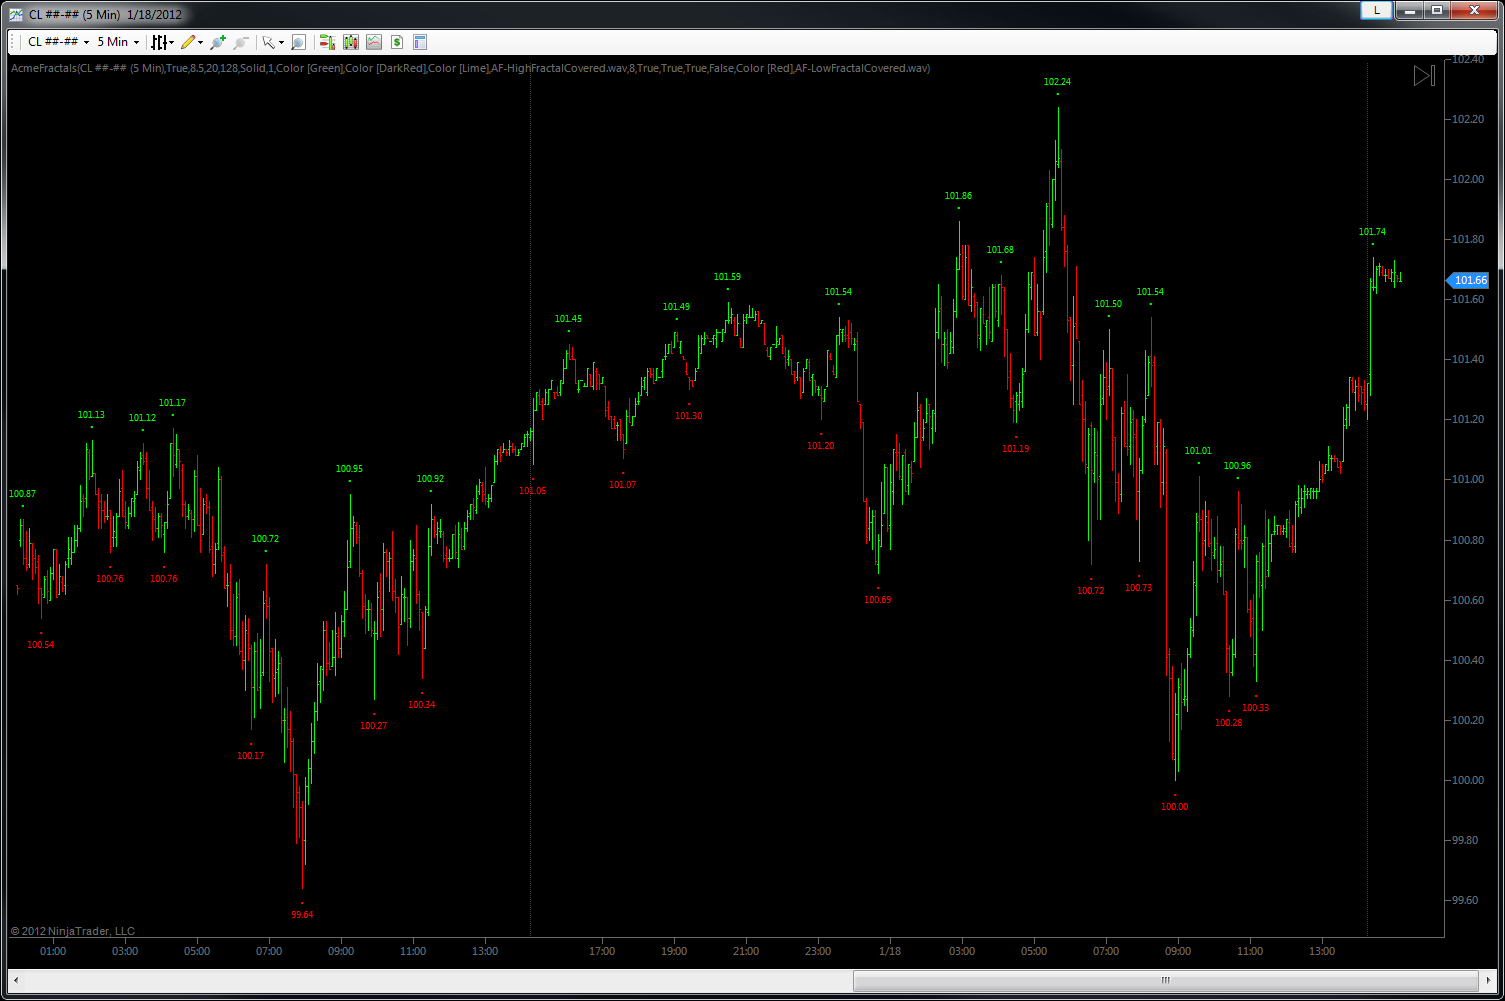
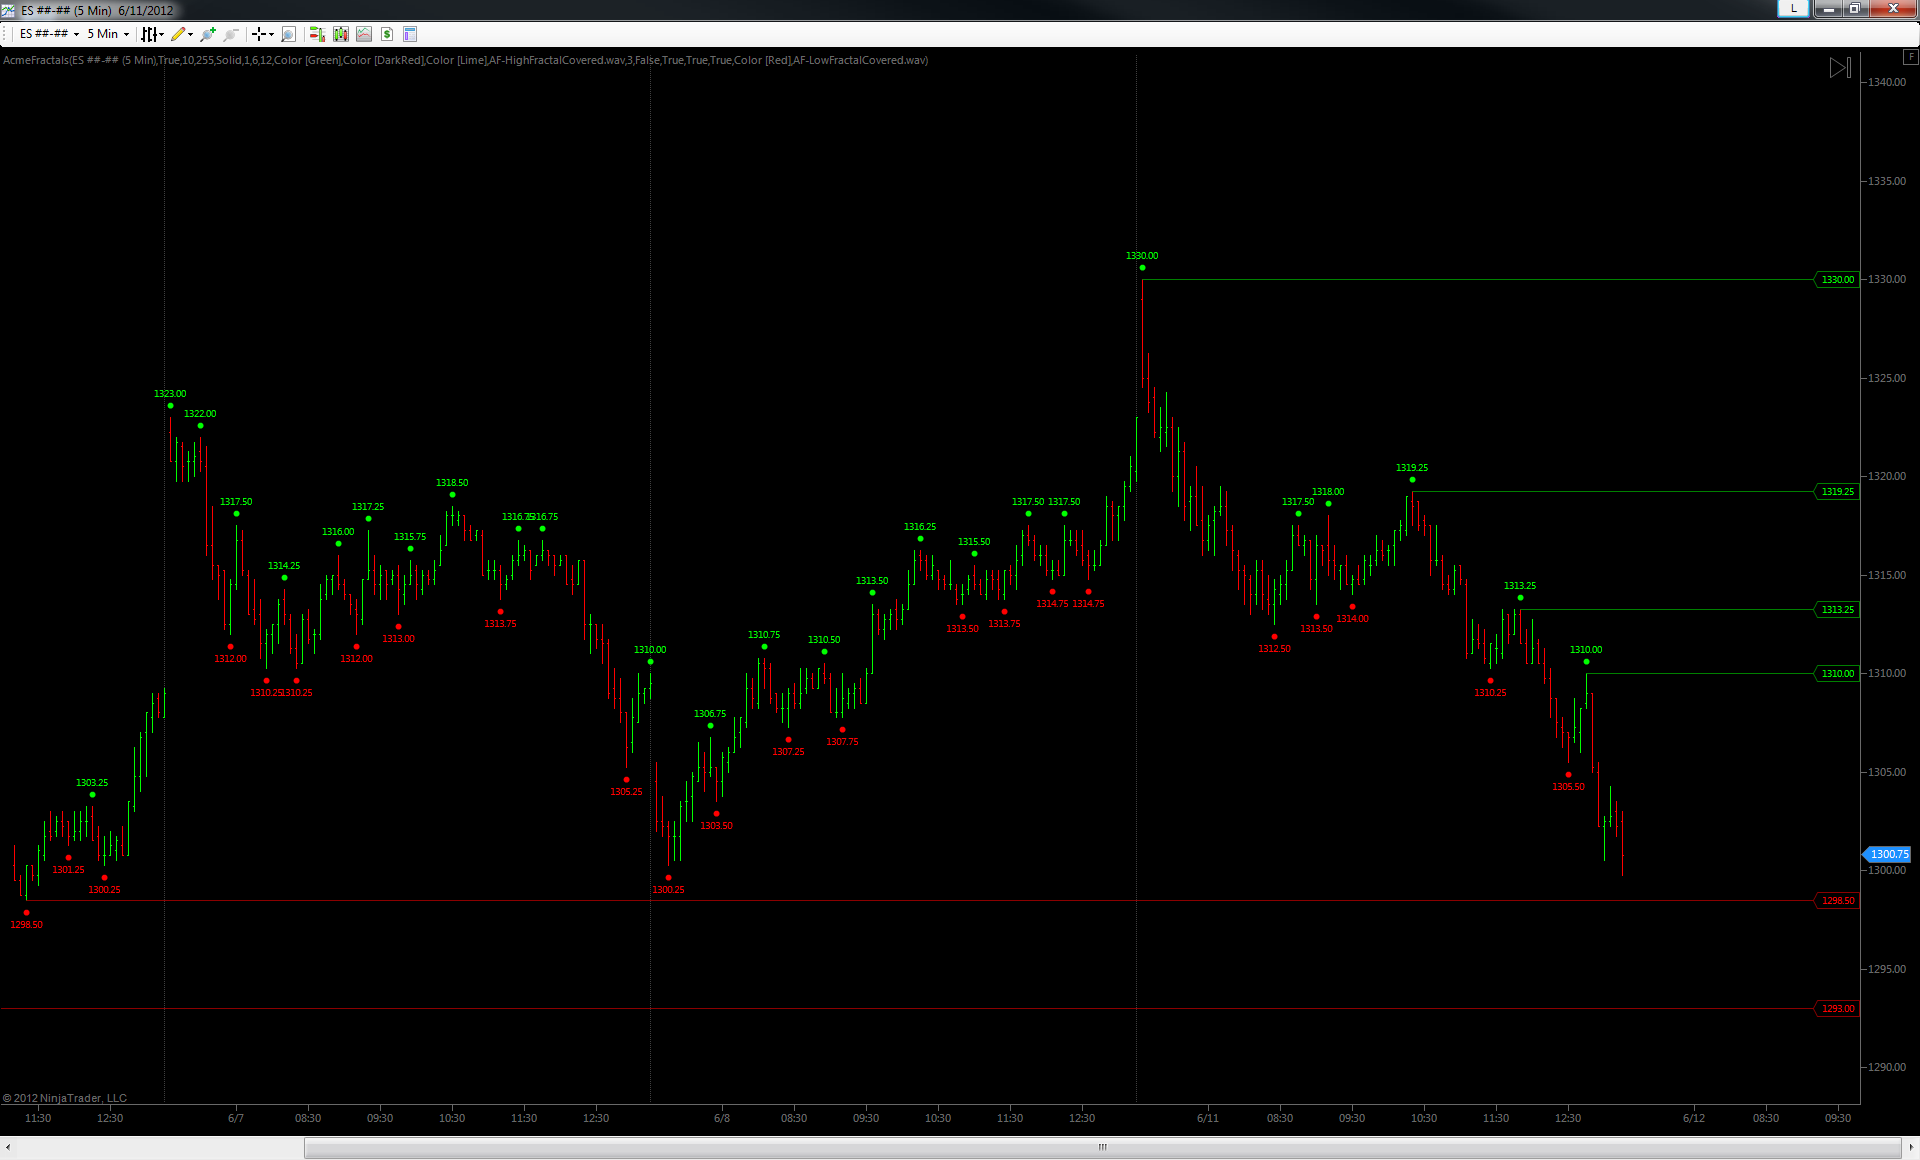
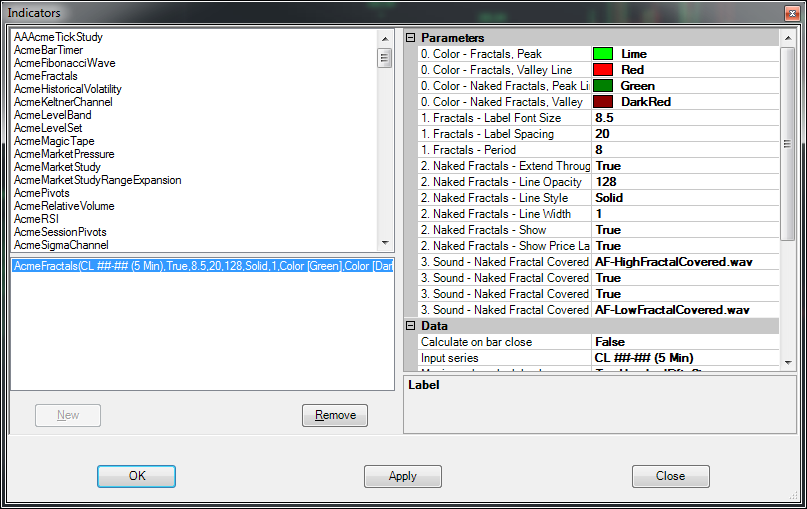
Fractals
Many traders have seen pictures of dots and prices at the peaks and valleys of the price action. You may have wondered what they are called. They are (somewhat cryptically) called fractals. And in some systems of technical analysis they are important in predicting reversals or continuations of the prevailing trend or swing. For others, they are a great way to keep track of which recent swing high and swing low prices have yet to be touched again, making it easy to visualize and quantify range narrowing/widening see breakouts/extensions well before they happen.
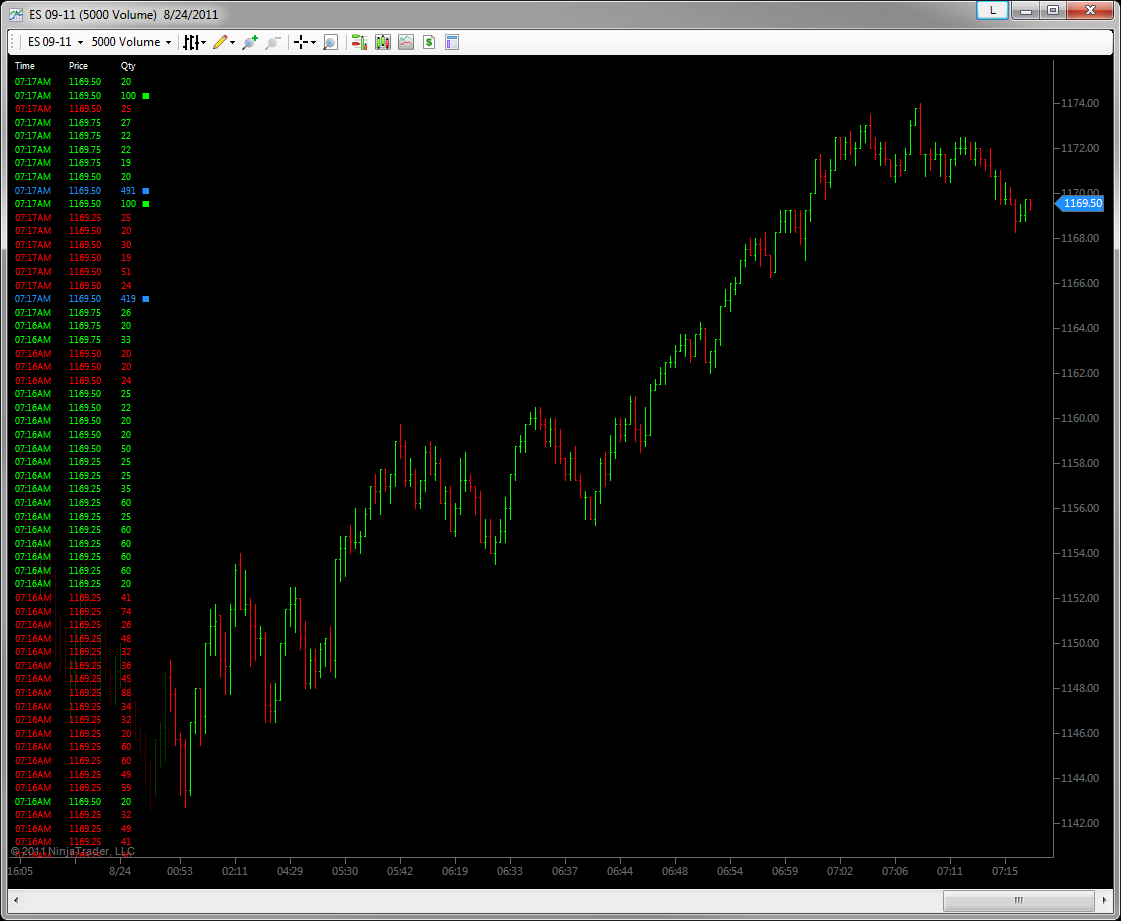
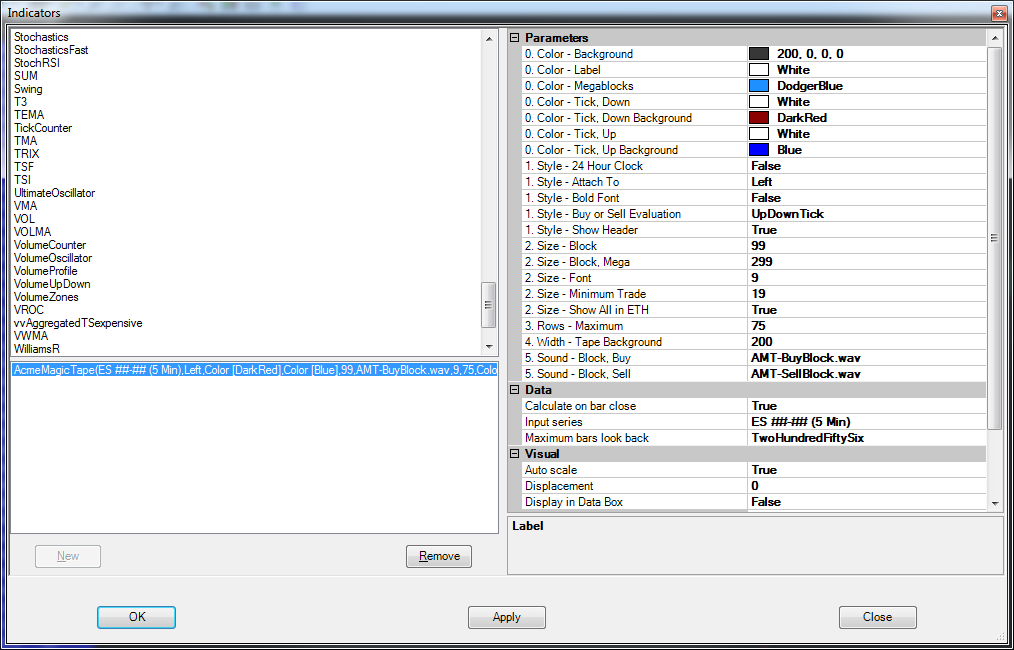
Magic Tape
Every trader has heard that you have to learn to “read the tape.” When starting out, no one tell you what that means, so many traders are not totally sure. But one of the ways you can develop an intuitive sense for a market is to watch transactions as they whiz by. How does it behave at important prices? When it’s in between important prices? And in certain instruments, it can be important to know when big volume or a fast blast of small volume is coming in.
Let’s be honest, most traders are pretty terrible at reading the DOM (the depth-of-market window). Of course many, if not most, short term traders use it for entry and exit. But many traders have never really liked trying to feel buying and selling pressure by watching the DOM. If you blink, you may miss something important!
Some traders say they can trade very effectively with nothing but the DOM. No charts. Not sure whether it’s good or bad, but many traders are way too visual. So if this sounds like you too, and you have a 150 or so spare pixels on the left side of one of your charts, then the Magic Tape might be of interest to you. NOTE: this indicator does not work at all with historical data. It’s for watching real-time transactions only. Great for placing in your peripheral vision.
It’s pretty simple, really. It’s a time and sales display. It’s the proverbial “tape.”

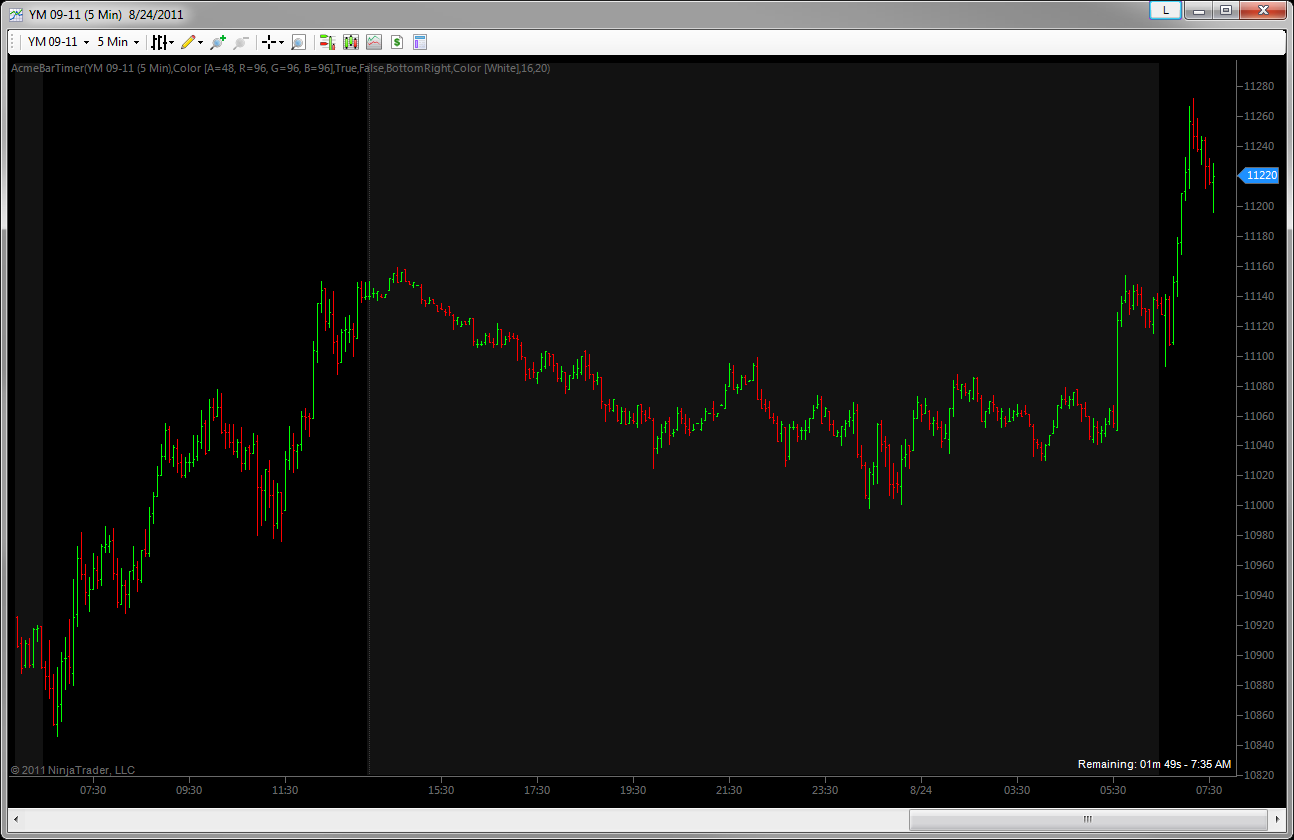
Bar Timer
This is one of those indicators gets used on lots of charts It has two primary functions. First, it shows at a glance the bars which are ETH and which are RTH. ETH bars can be shaded to any color you like, as below.
Secondarily, it will count down the values that remain on the most commonly used bar types – minute, tick and volume. For example, on the minute bars it will tell you how many minutes and seconds remain until the bar is complete. For tick and volume bars, it’ll show you how many ticks or contracts remain until the bar is complete.
You can move the “remaining” display (contracts/shares, time, etc) to any of the four corners of your chart.
The Bar Timer also has a “watermark mode” which can be handy to place on charts not actively traded but watched, such as currencies, energy, metals and bonds. Again, it helps distinguish everything at a glance. Helpful when you have a peripheral screen filled with smaller charts. You can adjust the color, opacity and size of the watermark to your liking.